Calculed Offset as Axis

Hi all,

I’m trying to get the following chart in Power BI (excel attached).

The model is very simple where you have 3 campaigns starting & ending at different dates and for each units are being sold. The goal is to create an axis which simply shows the amount of days (offset) from the start date of each campaign so they can be nicely compared. So the ask is, how can I make a this offset as a calculated column which I can then use as an axis?

Many thank in advanceedna - offset as axis.xlsx|attachment (21.7 KB)

@Wlknsn,

Rather than calculated columns, I would recommend just doing this upon load in Power Query, following a template like this for each campaign:

InsertDayOffset1= Table.AddColumn(Previous Step Name, “DayOffset1”, each Number.From([Date] - Campaign1Date), type number)

where Campaign1Date = #date(Year, Month, Day) for that campaign’s start date.

I hope that’s helpful.

  • Brian

That would work indeed, but would rule out any flexibility to set the offset base dynamically for instance:

  • First Date of Campaign Offset
  • First Date of Email sent

Just an example of course, so hoping it can be done easily using a calculated column.

@Wlknsn,

Okay, no problem. One thing is that your Excel file didn’t come through in the initial post. Can you please repost that and I will get you a calculated column solution shortly based on that data.

Thanks.

  • Brian

@Wlknsn,

Okay, I was able to OCR your screenshot to get the data in. Here are the results with the calculated column calculated via:

Campaign Date Offset = 
DATEDIFF(
    Data[Campaign Start Date],
    Data[Date],
    DAY
)

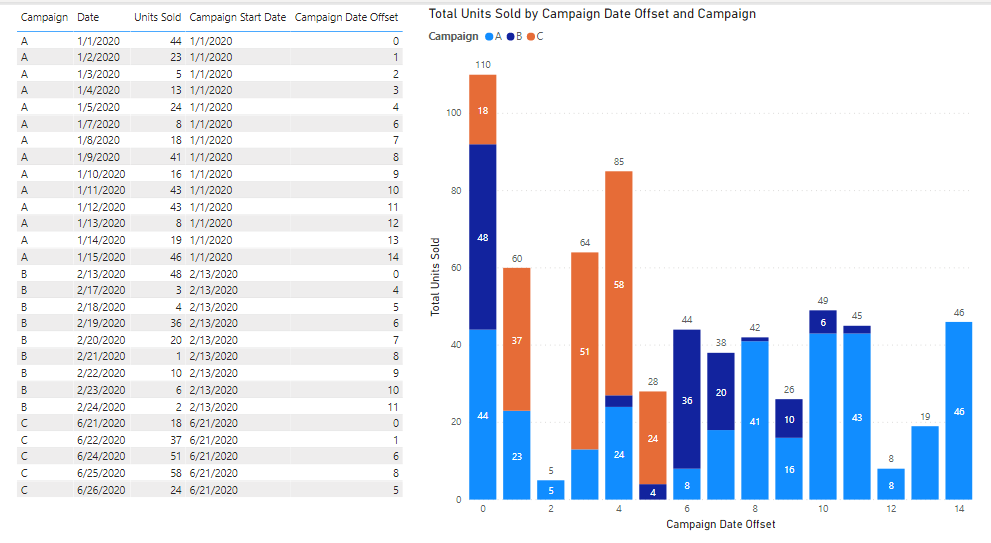
I would characterize this solution as “quasi–dynamic”. I created a disconnected table to hold the Campaign IDs and the Campaign Start Dates. You can update the campaign start dates in this table in Power Query and when you close and apply, it merges these dates with the main data based on Campaign ID.

I hope this is helpful. Full solution file attached below.

1 Like

Apologies for that, I added the excel as an attachment but it seems the link got broken somehow.

Many thanks so far, I’m going to be checking this out later today and come back to you, but big thanks in any case!

1 Like

My god, that’s an incredibly simple solution. Even if the data model wouldn’t be normalized as you did, a virtual table could be created or a calculate(min…) could be done which could then be leveraged in the simple datediff. Simple & nice!

Thanks :slight_smile:

PS: I still have an old one I need to get back to about concatenating and multiple relationships for which I still need to provide some sample data. Will do that shortly.

@Wlknsn,

Great - glad that was helpful.

The REALLY cool thing would be if the new Dynamic M parameters worked in Import mode. Then we could have the user select the campaign dates in a slicer/slider, which could then feed in dynamically to PQ.

But as you say, there are other techniques that could be used to mimic similar functionality…

  • Brian