Hi
The total count is working perfectly. Thanks again.
I’ve now been asked to find how many of each donation group are cancelling each week as a percentage of that donation group. For example if 10 donors in the ‘25 plus’ donations group cancel this week and there were 100 donors in this group at the beginning of the week, then this week 10% of this group have cancelled.
(Management wants to determine if we’re losing more of our valuable donors because of the coronavirus.)
I’ve loaded all the donations into my model (2.2 million) and created a calculated column to determine which group each donor is in. But this grouping will change from week to week as donations are added or donors are lost.
I’m wanting to be able to chart the weekly percentage of donors stopping for each donation group. And I’m stuck.
This is what I have so far.
The groups are:
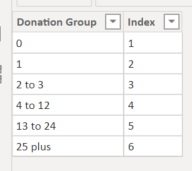
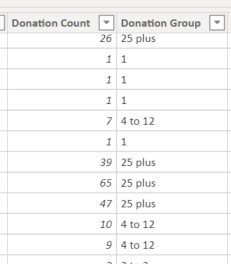
I have a calculated column to determine what group each donor is in but this is a snapshot as of today:
For this week I can calculate the number of donors in each group we’ve lost but how do I determine how many there were at the beginning of the week. Is it just (those lost + those left)?
For last week I’d need to recalculate the donation count for each donor based on what week it is and when they started giving and if they stopped - I have both dates.
Any guidance would be much appreciated. If my description is unclear please let me know.
Thanks