Calculating the Average frequency of Days Between Orders

Hi @BrianJ

Follow-up , the results are accurate and works 100% , but it has one limitation (The performance) will be very slow if you have big data > 2M it will gives out of memory problem, we will try to digg down how to solve the performance issue.

@MAAbdullah47,

Sorry ā€“ didnā€™t see your question. FYI ā€“ in the future, youā€™ll get a faster response if instead of responding to a closed thread, you start a new topic.

While Iā€™m not saying there arenā€™t ways potentially to optimize the solution I provided, I donā€™t think the improvement will be significant enough to give you a satisfactory result given the size of your dataset. There are certain DAX operations, such as RANKX, that are very calculation intensive and even when optimized are relatively slow. The previous value pattern at the core of this solution is another of those calculation intensive operations. Thus, I think the best bet for your situation would be to rework the solution in Power Query. It still may take significant time to execute it there, but at least you can do it on scheduled refresh and then once the report is open, it should perform quite well.

Imke Feldmann has provided a simple, and highly optimized approach to obtaining previous value in power query, using two indexes ā€“ one starting at 1, and the other at 0. Hereā€™s a blog entry that explains the process in detail:

I hope this is helpful, and invite others with more expertise in optimization to chime in here with their thoughts.

  • Brian
1 Like

Thank you @BrianJ Iā€™ll do.

Hi Brian, I tried to implement this solution to my dashboard but when I try to load a table with my Customer Name, Order Date and then drop in Prev Order Date, I just get the circle spinning in the top left corner infinitely. Thereā€™s no issue with relationships and the file file size is relatively small.

@Ndz1985 ,

Sorry, but thereā€™s not enough information for me to diagnose what the problem is. Iā€™ve run this solution on some pretty large datasets without a problem. If you can post your PBIX file, Iā€™d be glad to take a look.

  • Brian

Hi Brian,

Thanks for the reply.

.pbx available below:

https://drive.google.com/file/d/1t8vYBQdFt5Iky-Dp0ux-AV-cDt8l9C2p/view?usp=sharing

@Ndz1985 ,

I tested the DAX solution on your dataset, and it produces the right results but runs unacceptably slowly.

If you can please also send me the underlying data file in Excel or CSV, I will work on the Power Query solution, and see if I can get it to run at an acceptably fast speed using the Feldmann shift technique.

Thanks!

ā€“ Brian

1 Like

Hi @BrianJ

Thank you for your email , The data is the same for (EDNA) it is public DB you can take it from this forum , But i get your solution and practice it on my data , that is right it make the performance slow but the solution work 100%.

@MAAbdullah47 ,

Thanks for your message. I was actually requesting @Ndz1985 's data file, since we are working on the same problem that you and I worked on, but his dataset is over a million rows, so the DAX solution is just not very workable. Going to rework this in Power Query to try to speed it up.

ā€“ Brian

Hi Brain,

Really appreciate your assistance here. Iā€™ve exported the max I can to .csv. SQL Server didnā€™t export the headers so Iā€™ve entered what I think the important ones are. If you need others please let me know.

https://drive.google.com/file/d/1y0VhrwSS7vWUJeZnR5x-0rrj0uz7_KzG/view?usp=sharing

@Ndz1985 ,

OK, I think Iā€™ve got a pretty good outcome for you on this now.

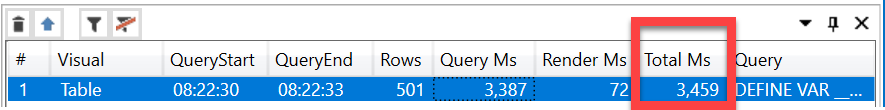
The DAX-only visual took minutes to run, whereas if you do most of the heavy lifting in PQ, Iā€™ve got the results down to being able to run the following results in under 3.5 seconds:

image

In truth, the PQ portion still takes a long time to run, but that perhaps can be done on scheduled refresh so that the user doesnā€™t bear the refresh time delay.

Basically, what I did was added a 0-based index and a 1-based index to the sales table, and did a self-join on the two index columns (i.e., the ā€œFeldmann Shiftā€, named for Imke Feldmann who first published this technique). This is an efficient way to calculate any previous value in PQ. I then wrote a couple of simple custom M statements to check that previous dates werenā€™t crossing over customers and then subtracted the current and previous date for each line.
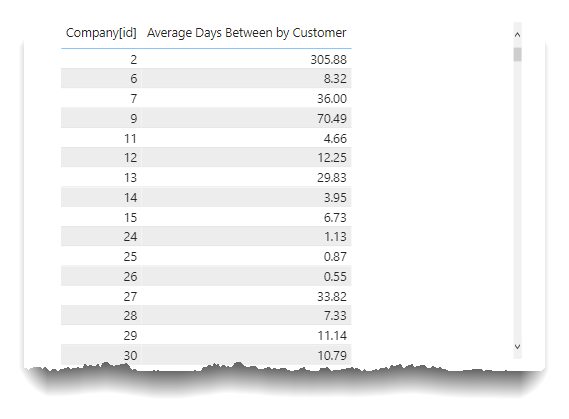
let
    Source = Csv.Document(File.Contents("C:\Users\brjul\Desktop\export\Data-Sales.csv"),[Delimiter=",", Columns=17, Encoding=1252, QuoteStyle=QuoteStyle.None]),
    #"Promoted Headers" = Table.PromoteHeaders(Source, [PromoteAllScalars=true]),
    #"Changed Type" = Table.TransformColumnTypes(#"Promoted Headers",{{"Sales[id]", Int64.Type}, {"Sales[CompanyID]", Int64.Type}, {"Sales[Reconciled Sales]", Int64.Type}, {"Sales[Quoted Sales Price]", Int64.Type}, {"Sales[DespatchDateLocal]", type text}, {"Sales[ToLocationId]", Int64.Type}, {"Sales[FromCompanyLocationId]", Int64.Type}, {"Sales[ConsignmentTrackingStatusId]", Int64.Type}, {"Sales[ToLocationId2]", Int64.Type}, {"Sales[CarrierServiceID]", Int64.Type}, {"Sales[TotalCostPrice]", Int64.Type}, {"Sales[TotalBaseCostPrice]", Int64.Type}, {"Sales[CarrierServiceID2]", Int64.Type}, {"Sales[TotalTaxCostPrice]", Int64.Type}, {"Sales[TotalVolume]", Int64.Type}, {"Sales[Sales Ex. GST]", Int64.Type}, {"Sales[Consignment Number]", type text}}),
    #"Split Column by Delimiter" = Table.SplitColumn(#"Changed Type", "Sales[DespatchDateLocal]", Splitter.SplitTextByEachDelimiter({" "}, QuoteStyle.Csv, false), {"Sales[DespatchDateLocal].1", "Sales[DespatchDateLocal].2"}),
    #"Changed Type1" = Table.TransformColumnTypes(#"Split Column by Delimiter",{{"Sales[DespatchDateLocal].1", type date}}),
    #"Removed Columns" = Table.RemoveColumns(#"Changed Type1",{"Sales[DespatchDateLocal].2"}),
    #"Sorted Rows" = Table.Sort(#"Removed Columns",{{"Sales[CompanyID]", Order.Ascending}, {"Sales[DespatchDateLocal].1", Order.Ascending}}),
    #"Added 0-based Index" = Table.AddIndexColumn(#"Sorted Rows", "Index", 0, 1, Int64.Type),
    #"Added 1-based Index" = Table.AddIndexColumn(#"Added 0-based Index", "Index.1", 1, 1, Int64.Type),
    #"Merged Queries" = Table.NestedJoin(#"Added 1-based Index", {"Index"}, #"Added 1-based Index", {"Index.1"}, "Added Index1", JoinKind.LeftOuter),
    #"Expanded Added Index1" = Table.ExpandTableColumn(#"Merged Queries", "Added Index1", {"Sales[CompanyID]", "Sales[DespatchDateLocal].1"}, {"Sales[CompanyID].1", "Sales[DespatchDateLocal].1.1"}),
    #"Reordered Columns" = Table.ReorderColumns(#"Expanded Added Index1",{"Sales[id]", "Sales[CompanyID]", "Sales[CompanyID].1", "Sales[Reconciled Sales]", "Sales[Quoted Sales Price]", "Sales[DespatchDateLocal].1", "Sales[ToLocationId]", "Sales[FromCompanyLocationId]", "Sales[ConsignmentTrackingStatusId]", "Sales[ToLocationId2]", "Sales[CarrierServiceID]", "Sales[TotalCostPrice]", "Sales[TotalBaseCostPrice]", "Sales[CarrierServiceID2]", "Sales[TotalTaxCostPrice]", "Sales[TotalVolume]", "Sales[Sales Ex. GST]", "Sales[Consignment Number]", "Index", "Index.1", "Sales[DespatchDateLocal].1.1"}),
    #"Renamed Columns" = Table.RenameColumns(#"Reordered Columns",{{"Sales[CompanyID].1", "Previous Sales Company ID"}, {"Sales[id]", "ID"}, {"Sales[Reconciled Sales]", "Reconciled Sales"}, {"Sales[Quoted Sales Price]", "Quoted Sales Price"}, {"Sales[DespatchDateLocal].1", "DespatchDateLocal.1"}, {"Sales[ToLocationId]", "ToLocationId"}, {"Sales[FromCompanyLocationId]", "FromCompanyLocationId"}, {"Sales[ConsignmentTrackingStatusId]", "ConsignmentTrackingStatusId"}, {"Sales[ToLocationId2]", "ToLocationId2"}, {"Sales[CarrierServiceID]", "CarrierServiceID"}, {"Sales[TotalCostPrice]", "TotalCostPrice"}, {"Sales[TotalBaseCostPrice]", "TotalBaseCostPrice"}, {"Sales[CarrierServiceID2]", "CarrierServiceID2"}, {"Sales[TotalTaxCostPrice]", "TotalTaxCostPrice"}, {"Sales[TotalVolume]", "TotalVolume"}, {"Sales[Sales Ex. GST]", "Sales Ex. GST"}, {"Sales[Consignment Number]", "Consignment Number"}, {"Index", "Index 0-based"}, {"Index.1", "Index 1-based"}, {"Sales[DespatchDateLocal].1.1", "DespatchDateLocal Previous"}}),
    #"Reordered Columns1" = Table.ReorderColumns(#"Renamed Columns",{"ID", "Sales[CompanyID]", "Previous Sales Company ID", "DespatchDateLocal.1", "DespatchDateLocal Previous", "Reconciled Sales", "Quoted Sales Price", "ToLocationId", "FromCompanyLocationId", "ConsignmentTrackingStatusId", "ToLocationId2", "CarrierServiceID", "TotalCostPrice", "TotalBaseCostPrice", "CarrierServiceID2", "TotalTaxCostPrice", "TotalVolume", "Sales Ex. GST", "Consignment Number", "Index 0-based", "Index 1-based"}),
    #"Renamed Columns1" = Table.RenameColumns(#"Reordered Columns1",{{"DespatchDateLocal.1", "DespatchDateLocal"}}),
    #"Added Custom" = Table.AddColumn(#"Renamed Columns1", "Previous Order Date", each if [#"Sales[CompanyID]"] = [Previous Sales Company ID] then [DespatchDateLocal Previous] else null),
    #"Reordered Columns2" = Table.ReorderColumns(#"Added Custom",{"ID", "Sales[CompanyID]", "Previous Sales Company ID", "DespatchDateLocal", "DespatchDateLocal Previous", "Previous Order Date", "Reconciled Sales", "Quoted Sales Price", "ToLocationId", "FromCompanyLocationId", "ConsignmentTrackingStatusId", "ToLocationId2", "CarrierServiceID", "TotalCostPrice", "TotalBaseCostPrice", "CarrierServiceID2", "TotalTaxCostPrice", "TotalVolume", "Sales Ex. GST", "Consignment Number", "Index 0-based", "Index 1-based"}),
    #"Added Custom1" = Table.AddColumn(#"Reordered Columns2", "Days Between", each if [Previous Order Date] = null then null else [DespatchDateLocal] - [Previous Order Date]),
    #"Changed Type2" = Table.TransformColumnTypes(#"Added Custom1",{{"Days Between", Int64.Type}})
in
    #"Changed Type2"

All thatā€™s left to do is calculate the average days between by customer, which I did via the following DAX measure (although it could be done in PQ if you donā€™t need for this to be dynamic, say sliced by date).

Average Days Between by Customer =

CALCULATE(
    AVERAGE( Sales[Days Between] ),
    ALLEXCEPT( 
        Company,
        Company[id]
    )
)

I hope this is helpful. Full solution file attached. (Note: I had trouble with your CSV file, so I pushed the whole set of CSV files out of the model with Power BI Exporter, and then reimported them - thatā€™s why some of the column names are wonkyā€¦)

  • Brian

Brian, this is absolutely fantastic. Iā€™ve learnt a new skill going through this process.

Really appreciate it.

Thank you

@Ndz1985 ,

Thatā€™s great to hear. Definitely some cool tricks in this one that I learned from Imke and @Melissa that Iā€™m happy to be able to pass along.

If you havenā€™t yet, I cannot recommend highly enough going through Melissaā€™s new Power Query course on the EDNA learning portal - it is filled with gems like this, and really has had a major impact on elevating my own skill set.

  • Brian

Iā€™ll take you up on that advice.

Thanks again.

1 Like