Hi,
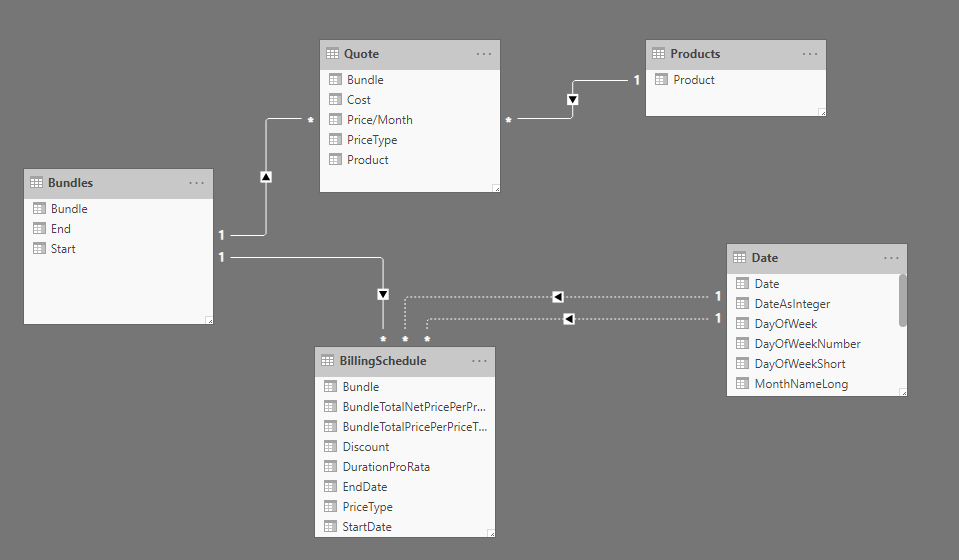
I’m looking for a solution to calculate the monthly revenue of products (onetime) and services (monthly recurring). The Data model is the following:
| Proposal | ||||||||||||
|---|---|---|---|---|---|---|---|---|---|---|---|---|
| Bundle | Product | PriceType | Price/Month | Cost | ||||||||
| X | A | Recurring | 100 | 50 | ||||||||
| X | B | Recurring | 150 | 70 | ||||||||
| X | C | Recurring | 125 | 40 | ||||||||
| X | D | OneTime | 3500 | 1200 | ||||||||
| Y | A | Recurring | 100 | 40 | ||||||||
| Y | D | OneTime | 3500 | 1200 | ||||||||
| Z | B | Recurring | 150 | 70 | ||||||||
| Z | C | Recurring | 125 | 40 | ||||||||
| Z | D | OneTime | 3500 | 1200 | ||||||||
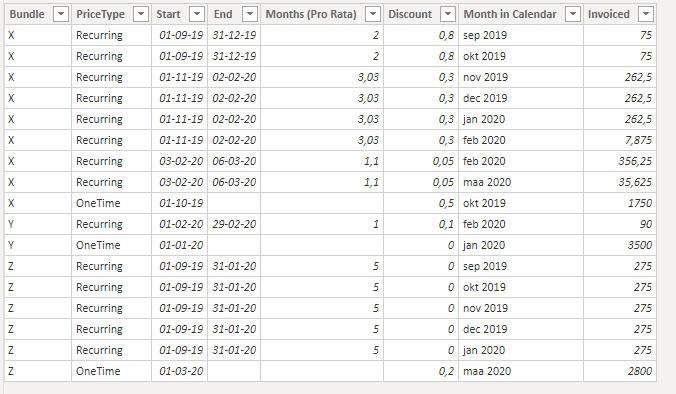
| Billing | ||||||||||||
| Bundle | PriceType | Start | End | Months (Pro Rata) | Discount | sep/19 | okt/19 | nov/19 | dec/19 | jan/20 | feb/20 | mrt/20 |
| X | Recurring | 1/09/2019 | 31/10/2019 | 2,00 | 80% | 75 | 75 | |||||
| X | Recurring | 1/11/2019 | 2/02/2020 | 3,03 | 30% | 262,5 | 262,5 | 262,5 | 7,875 | |||
| X | Recurring | 3/02/2020 | 6/03/2020 | 1,10 | 5% | 356,25 | 35,625 | |||||
| X | OneTime | 1/10/2019 | 50% | 1750 | ||||||||
| Y | Recurring | 1/02/2020 | 29/02/2020 | 1,00 | 10% | 90 | ||||||
| Y | OneTime | 1/01/2020 | 0% | 3500 | ||||||||
| Z | Recurring | 1/09/2019 | 31/01/2020 | 5 | 0% | 275 | 275 | 275 | 275 | 275 | ||
| Z | OneTime | 1/03/2020 | 20% | 2800 | ||||||||
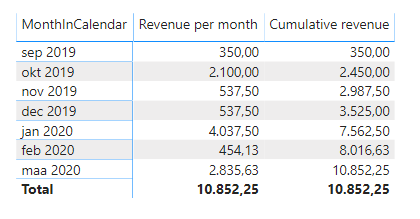
| Total Revenue / Month | 350 | 2100 | 537,5 | 537,5 | 4037,5 | 454,125 | 2835,625 | |||||
| Product | sep/19 | okt/19 | nov/19 | dec/19 | jan/20 | feb/20 | mrt/20 | |||||
| A | 20 | 20 | 90 | |||||||||
| B | 30 | |||||||||||
| C | 25 | |||||||||||
| D | 1750 | 3500 | 2800 |
As you can see, per bundle you may have multiple products which could have a specific pricetype to be applied to define the behavior of the pricing. Recurring products are combined and can then be split up in various periods (see the billing table), also here a discount is applied for each of those periods. All this is existing model.
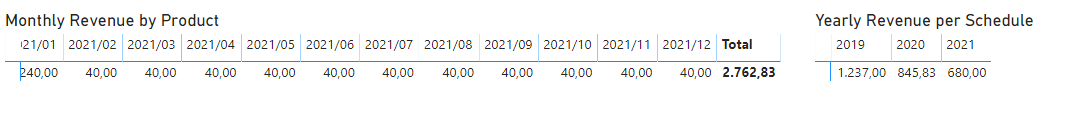
The measure I’m looking for has the ability to show the actual revenue per month (pro rata) for each of those billing lines, or also from a product dimension perspective. (so sum of products per pricetype per bundle -> Per month * discount)
Eventually I will be looking for also the cumulative total (but should be easy from the monthly revenue).