Calculating Budget v Actual Difference to Last Month End

Hi there,

I’m wanting to calculate a stretch target that the Board of Directors has requested in a company I’m CFO for. I can get the measure to work on a graph because that filters everything by date. However, I want to display the measure as a card. And that’s causing me issues. Essentially I’m looking for a DAX formula to do this for me where the budgeted figures into the future are ignored.

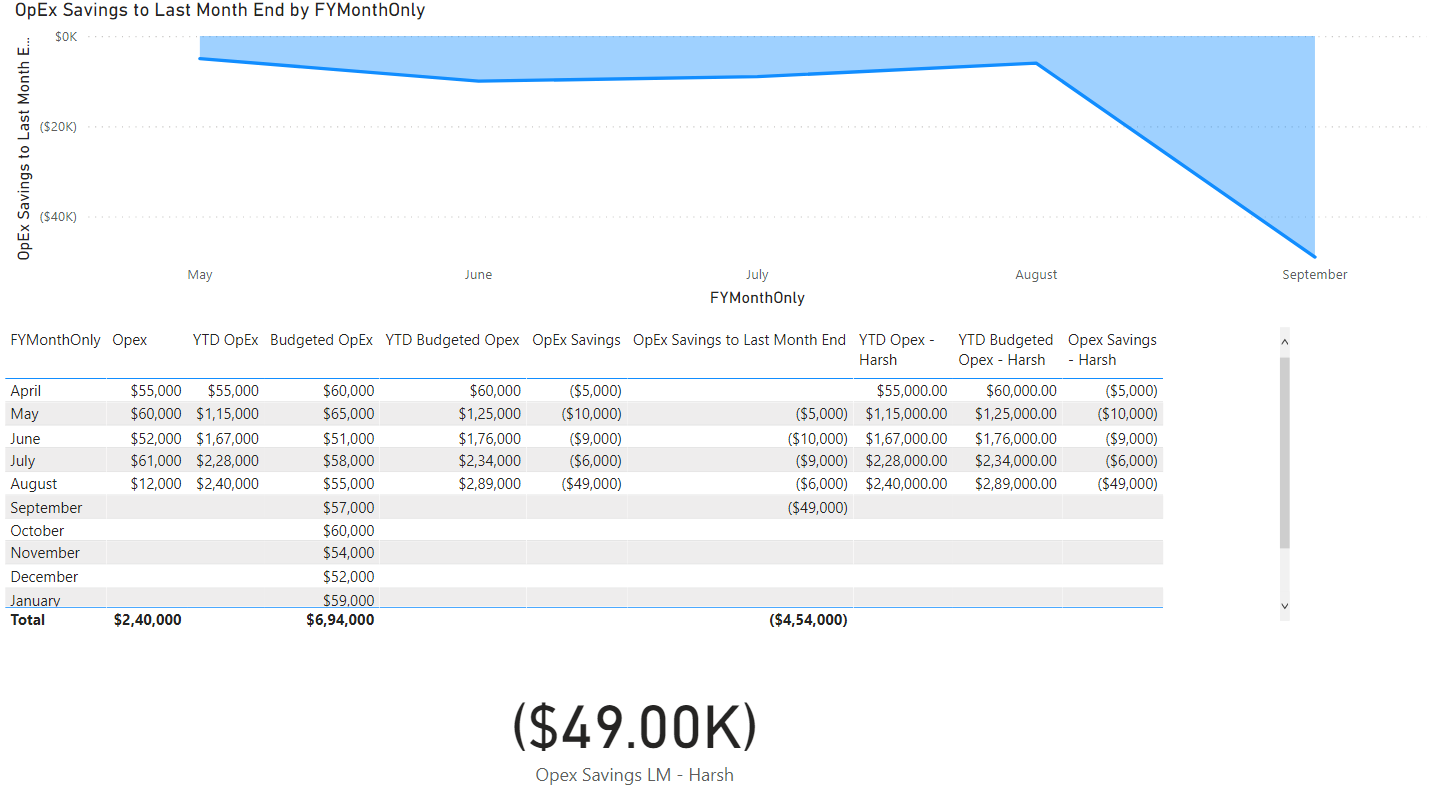
I’ve been asked to target an additional Operating Expenditure Savings for the year of $XXX. I’ve got live data coming into the model from an Azure Database. That Database also holds the agreed budget as well. I’m only wanting to calculate the YTD savings to the latest month end date because if I have it through to the current date it’s essentially nonsense because the month hasn’t ended so the savings are artificially inflated. To put it another way, if we’re in September, I only want to show the YTD Savings through to the end of August.

The measures I’ve got essentially go Cumulative Actual Opex less Cumulative Budgeted Opex = Savings. That works fine on a graph as I can zero out future months on the graph with an if statement. However it doesn’t work on a card because I’ve got Budgeted Opex all the way through to the end of the year but I obviously don’t have Actual Opex. This means my savings make no sense because its telling me we’ve spent $0 in future months so the savings are huge … which is nonsense as I said above.

So I’m looking for a Dax formula that tells the calculation to ONLY add up all actual and budgeted expenditure up to the end of the last month and ignore everything else after that. This is what is working on a graph, but is proving no good in a card:

OpEx Saved to Last Month End = IF([Operating Expenses]=0,"",
CALCULATE([YTD Savings],DATEADD(‘Date Table’[Date],-1,MONTH)))

I know this probably sounds easy, but it’s got me stumped today!

Thanks in advance
Paul

Hello @5thGreen,

Thank You for posting your query onto the Forum.

Well, firstly it’s always a little bit difficult for the Forum members to assist and provide the solution in a better and efficient manner without looking at the working of the PBIX file for the reference.

If you’re using the @Melissa’s Extended Date Table then it’ll definitely solve your problem.

Since you want the results of YTD till Last Month you can use the column of “MonthCompleted” from Dates Table in your measure.

I’m attaching the working of the PBIX file for the reference purpose.

Hoping you find this useful and meets your requirements that you’ve been looking for. :slightly_smiling_face:

Note: If this doesn’t meets your requirements then I request you to please upload the demo data alongwith the results that you’re trying to achieve.

Thanks and Warm Regards,
Harsh

Sales Last Month YTD - Harsh.pbix (69.7 KB)

Hi @Harsh

Thanks for your message. I understand the point re it being difficult without the pbix file. It’s not something I’m willing to share though because of all the data in it. Masking it all would take some time so instead I’ve made a little file to illustrate my problem

You’ll see in both the area graph and the table, the OpEx Savings to Last Month End are $49,000. That’s a cumulative YTD figure and that is the figure I want to display on the card. However, you’ll note that on the card, $393,000 is showing. That’s because the DAX formula is simply OpEx - Budgeted OpEx = Savings. Now because some of the months haven’t occurred yet there is no Actual OpEx. But there is Budgeted OpEx through to the end of the financial year (I’m in NZ. Our financial year goes 1 Apr - 31 Mar).

Because my DAX formula is picking up all those future budgeted figures it is returning a massive savings because the actuals are all 0’s right now … which makes senses given those months haven’t happened yet. So I need to make my formula ignore ALL budgeted OpEx after the last month end.

Essentially I want my formula to say "Add up all Operating Expenditure up to the end of the last completed month and subtract the Budgeted Operating Expenditure up to the end of the last completed month to give the savings/over expenditure that has occurred over that period"

Does that make sense? I hope so.

Also in case you’re wondering why I want the savings up to the end of the last month to show in the current month rather than savings up to the actual date, there is a good reason. Until a month is completed, the savings will be wrong as not all expenditure is in so the number is unreliable. Showing the actual savings up to the end of the last month is a locked in and reliable figure.

Thanks also for mentioning the date table. I don’t use that one and in fact hadn’t seen it until you pointed it out to me. The Week/Month/Quarter Completed columns are excellent and would certainly help. I’ve always used the code that Sam provided and then added on a few useful columns that Brian told me about. Perhaps I need to move to this new table? I’m just a little reluctant to do so for fear of breaking other things like getting my months in the right order on graphs i.e. April as month 1, March as month 12.

Thanks again
Paul
Savings Example.pbix (90.0 KB)

Hello @5thGreen,

Firstly, thank you so much for providing the PBIX file for the reference purposes alongwith the explanation of the results that you’re trying to achieve. This makes things easier for understanding purposes.

Now, my small question here before I provide the solution - Why use “TOTALYTD()” function when “DATESYTD()” function is lot easier to use and they’ll provide the exact same results.

So what I actually did in your PBIX file is, firstly I loaded the Extended Date Table by replacing the old M Code with the New One. Secondly, I created my own set of formulas for YTD results using “DATESYTD()” function. Below are the formulas provided for the reference (For Opex Savings Last Month measure, you’ll observe that I’ve used “MonthCompleted” column from the Dates table and generated the results)-

YTD Opex - Harsh = 
VAR _YTD_Opex = 
CALCULATE( [Opex] , 
    DATESYTD( 'Date Table'[Date] , "31/3" ) )

RETURN
IF( ISBLANK( [Opex] ) , 
    BLANK() , 
    _YTD_Opex )


YTD Budgeted Opex - Harsh = 
VAR _YTD_Budgeted_Opex = 
CALCULATE( [Budgeted OpEx] , 
    DATESYTD( 'Date Table'[Date] , "31/3" ) )

RETURN
IF( ISBLANK( [Opex] ) , 
    BLANK() , 
    _YTD_Budgeted_Opex )


Opex Savings - Harsh = 
[YTD Opex - Harsh] - [YTD Budgeted Opex - Harsh]


Opex Savings LM - Harsh = 
CALCULATE( [Opex Savings - Harsh] , 
    'Date Table'[MonthCompleted] )

Below is the screenshot of the final results provided for the reference purposes -

I’m also attaching the working of the PBIX file for the reference purposes as well as providing the link of an article pertaining to “DATESYTD() V/s TOTALYTD” function.

Hoping you find this useful and meets your requirements that you’ve been looking for. :slightly_smiling_face:

Note: The formula pattern used in the current working file is the same as was used in the previously provided file.

Thanks and Warm Regards,
Harsh

Savings Example - Harsh.pbix (114.2 KB)

4 Likes

Thanks so much for your assistance Harsh. I really appreciate it! :smiley:

Take care
Paul

Hello @5thGreen,

You’re Welcome. :slightly_smiling_face:

I’m glad that I was able to assist you.

Thanks and Warm Regards,
Harsh