I want to calculate a average column based on variable criteria.
Attached is an Excel sheet which shows an example but I need to do the same in Power BI.
Example case table.xlsx (9.4 KB)
I want to calculate a average column based on variable criteria.
Attached is an Excel sheet which shows an example but I need to do the same in Power BI.
Example case table.xlsx (9.4 KB)
Hi @PaulBoyes
To help the forum members, could you please provide:
Greg
Hi,
I have not yet tried to put this into Power BI so I do not have a pbix file yet.
In the Excel example I included there are two tables, the one on the left showing the source and the one on the right with the desired result.
What I am looking for is an example measure that could be used to create that desired result.
Best regards
Paul
Hi @PaulBoyes. Once you have tried, if there are still issues, please upload your work-in-progress PBIX and a marked-up screenshot of your visual noting where it falls down.
Greg
Hi @PaulBoyes,
Give this a go. You can paste the M script into a New Blank Query.
let
    Source = Table.FromRows(Json.Document(Binary.Decompress(Binary.FromText("i45WMjIwMDBS0lHySy0HkmYGBkqxOhBRY7ioiSlC1AQuaoqk1hQuak5VUTO4qDGaaFBqWWZxagrIdUgy5qg+iQUA", BinaryEncoding.Base64), Compression.Deflate)), let _t = ((type nullable text) meta [Serialized.Text = true]) in type table [#"Case No" = _t, Status = _t, Quote = _t]),
    ChType = Table.TransformColumnTypes(Source,{{"Case No", Int64.Type}, {"Quote", Int64.Type}}),
    GroupRows = Table.Group(ChType, {"Case No"}, {{"GroupAll", each _, type table [Case No=nullable number, Status=nullable text, Quote=nullable number]}}),
    UpdateTables = Table.AddColumn( GroupRows, "NewTable", each
        let
            myTable = [GroupAll],
            UpdateList = if List.ContainsAll( {"New"}, myTable[Status] )=true then List.FirstN(myTable[Quote], 1) & List.Transform( List.Skip(myTable[Quote], 1), each _ - _ ) else List.FirstN(myTable[Quote], 1) & List.Transform( List.Skip(myTable[Quote], 1), each _ - myTable[Quote]{List.PositionOf(myTable[Status], "Revised", 0)-1}? ),
            NewTable = Table.FromColumns( List.RemoveLastN( Table.ToColumns(myTable), 1 ) & {UpdateList} ),
            NameCols = Table.RenameColumns( NewTable, List.Zip( { Table.ColumnNames(NewTable), Table.ColumnNames(myTable)}))
        in
            NameCols
    )[[Case No], [NewTable]],
    ExpandNewData = Table.ExpandTableColumn(UpdateTables, "NewTable", {"Status", "Quote"}, {"Status", "Quote"})
in
    ExpandNewData
I hope this is helpful
Hi
Thank you for this, very impressive.
However, I would like to try to solve the problem using DAX if possible.
I have attached a pbix file that has a single table where I want the calculate the value of the revised quote column using the example in the Excel file I attached previously…
Thanks in anticipation.
PaulAverage Quote Calculation.pbix (17.3 KB)
Hi @PaulBoyes,
Think there are many ways to achieve this.
I added a group index in power query.
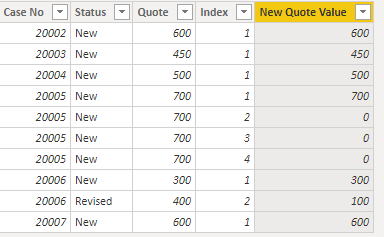
Added your calculated column (adjust to your needs)
New Quote Value =
VAR myCase = 'DAX Solution'[Case No]
VAR myStatus = 'DAX Solution'[Status]
VAR myIndex = 'DAX Solution'[Index]
VAR myValue = 'DAX Solution'[Quote]
VAR firstVal =
    CALCULATE( MAX( 'DAX Solution'[Quote] ),
        FILTER( ALL( 'DAX Solution' ),
            'DAX Solution'[Case No] = myCase &&
            'DAX Solution'[Index] = 1
        )
    )
VAR GroupStatus =
    COUNTROWS(
        CALCULATETABLE( VALUES( 'DAX Solution'[Status] ),
            FILTER( ALL( 'DAX Solution' ),
                'DAX Solution'[Case No] = myCase
            )
        )
    )
RETURN

SWITCH( TRUE(),
    GroupStatus =1 && myIndex =1, myValue,
    GroupStatus =1 && myIndex <>1, 0,
    GroupStatus =2 && myIndex =1, myValue,
    GroupStatus =2 && myIndex <>1, myValue - firstVal
)
.
Same result as earlier PQ solution
.
Here’s your sample file. Average Quote Calculation.pbix (22.1 KB)
I hope this is helpful
