We are an inspection company. One of the things we track is total number of inspections each month (this would be similar to qty sold). I want to be able to show, in a chart, the last 5 full months of inspections (per month) and the current month to date. For example:
It is August 16th. Have a field called [Inspections]. Want to see:
March = 25
April = 34
May = 50
June = 58
July = 45
August = 21 (MTD)
Interesting one.
I’ve mocked it up.
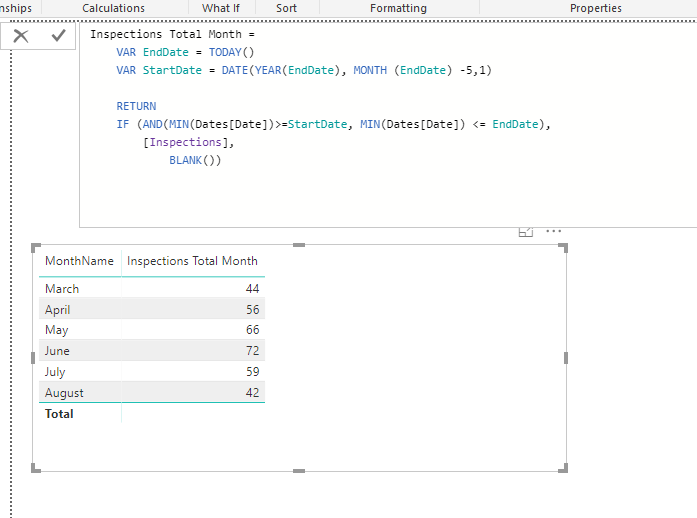
Due to my data not being up to the current date you may want to adjust slightly (where I have ‘EndDate’ you might want this formula to be TODAY() instead of what I have used.
I’ve just used the last purchase date instead
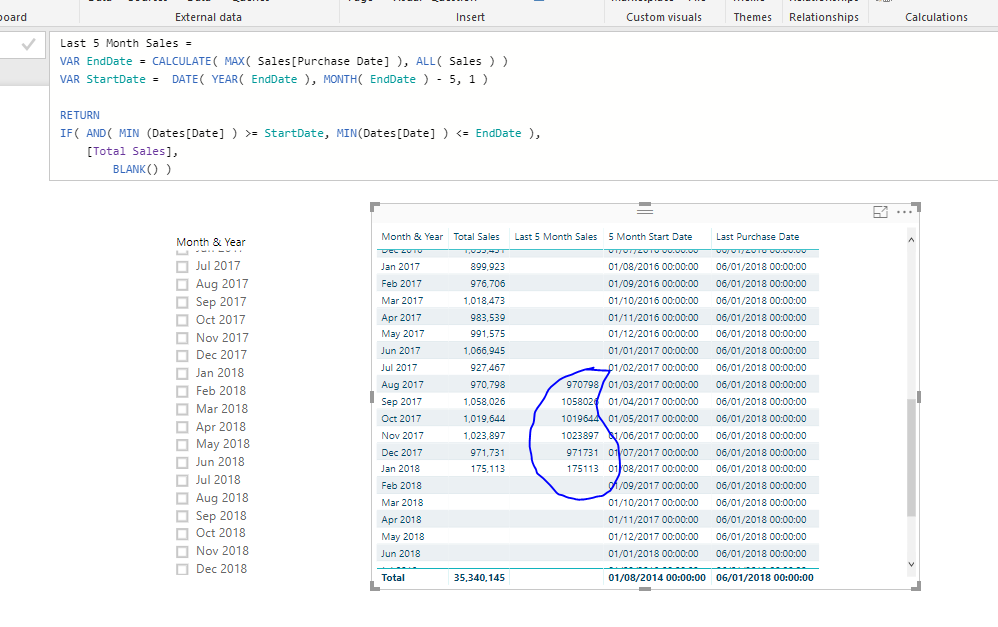
Here’s is the formula and results
Last 5 Month Sales =
VAR EndDate = CALCULATE( MAX( Sales[Purchase Date] ), ALL( Sales ) )
VAR StartDate =  DATE( YEAR( EndDate ), MONTH( EndDate ) - 5, 1 )

RETURN
IF( AND( MIN (Dates[Date] ) >= StartDate, MIN(Dates[Date] ) <= EndDate ),
    [Total Sales],
        BLANK() )
You’ll see that I just broke it down and looked to work out each part bit by bit.
The main idea was working out the two end and start dates so they would be dynamic.
I think they technique used is the right one.
See how you go with this.
This worked. Thank you. The only issue i am having is i have to filter the visualization by year. Since the order table has multiple years in it, if i don’t filter then i get no data. What am i missing? I only want most recent 6 months, even if there aren’t any sales.
Yes this is due to the context of the calculation. Without a year context (or selection ) the Month Name will always filter for every single year.
My personal preference is the have either the year filter or have the Month & Year column within the table. That makes it clearer for the user.
Is there a reason why you need to use the MonthName specifically?