It would help if you could post your PBIX file to see if I’m missing anything here, but based on your description above I think all you need to do is create two more measures that calculate the sum of your [Levy=floor] and [Levy>floor] measures. Then you can drop those two new measures into cards to show the respective totals.
If your question is how to get the proper totals for each column in your table visual, please take a look at posts #11 and #14 in this topic, where I walked through this in detail with another member.
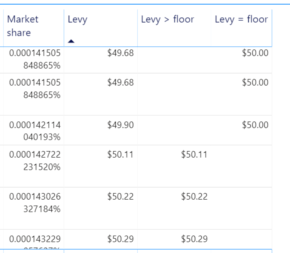
I am trying to work out the sum of all the levy that equal 50
And then the sum of the others.
So that I can create a new market share for those who do not pay the minimum floor levy, subtract the total of those that pay the minimum floor from the total to be recovered (31.1 mill) and then apportion to those that are not paying the floor amount by the new market share.
Thanks very much for posting the files. However, the CSV file you posted does not correspond to the PBIX. I think you meant post an Excel file instead. If that’s the Excel file that you used to bring the data into Power BI, can you please post that?
This shouldn’t be difficult, but I’m getting some funky results on the calculations branching off the >$50 measure that I want to check against the original data in Power Query to figure out what’s going on.
Hi Brian,
You are very patient. Thank you. The files are over 4MB (one 11MB the other about 5MB) so I cut things down, but that likely added to confusion.
Whew! This one was much harder to crack than I expected. As you and I were both thinking, this seemed like it should have been pretty straightforward. However, there were two problems buried deep that were throwing the numbers off:
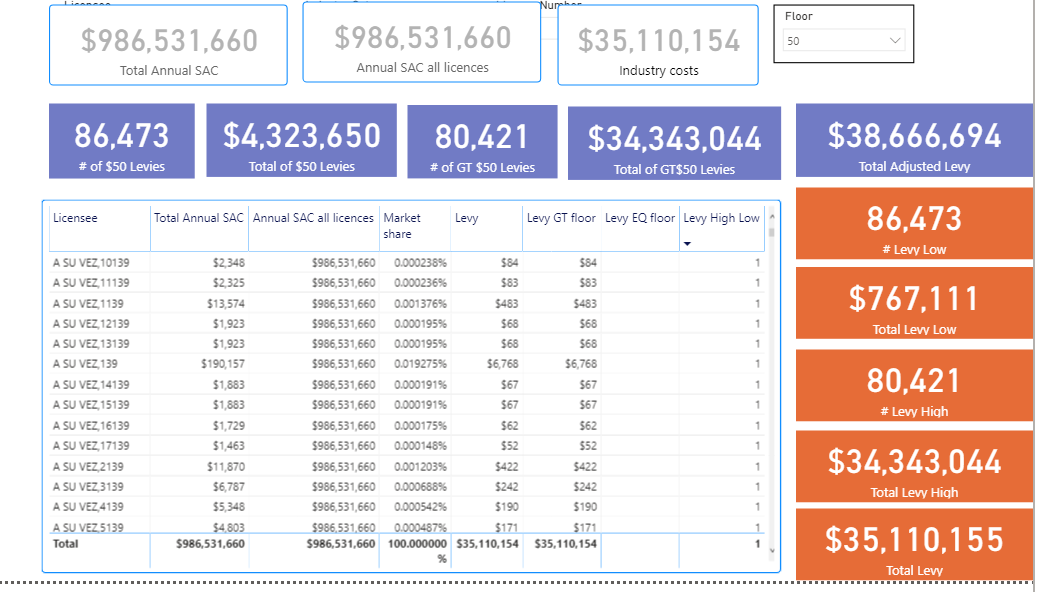
Your Licensee lookup was creating a circular reference that was throwing off crazy numbers ($92 Billion in one measure…). In the tables and cards, I used the Data[Licensee] field instead, and got rid of the one column lookup table.
you had a column AND a measure both called “Annual SAC”, and one was used in the wrong place somewhere . I renamed the measure [Total Annual SAC] and corrected the reference.
In the screenshot below, the cards in blue represent the adjusted levies, employing the $50 floor. The orange are the unadjusted levies, with “low” corresponding to <= $50, and “high” being above $50.
Amazing trouble shooting. You are very talented. I will take a close look and hopefully learn much from it. Thank you so much for your time and accepting the challenge, especially when there were model issues that you identified.
In the early stages of trying to figure out what was going on, I thought maybe the use of = or > in a measure name was causing problems, so I renamed them to rule that out.
I should have started looking for model problems earlier than I did. When fairly basic DAX throws out crazy results, it’s almost always a problem with the data model.
I don’t understand what was wrong with taking the licensees out of the data table and using them as a lookup table with = VALUES(Data[Licencee]), but perhaps that wasn’t the issue?
You mentioned a circular reference? Is that referring to the above? Should I not use VALUES(
to create a unique lookup list in models?
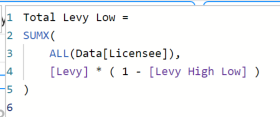
Thanks. I was trying to figure out how much of an increase in levies you achieved by setting the floor amount, and that construct ended up working out well.
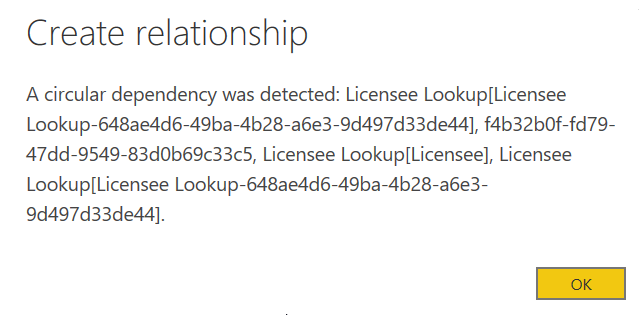
Per your earlier question, generally, I don’t think you will want to use VALUES() on your fact tables to create lookup tables. That is where the circular reference problem came from. I couldn’t get the error to replicate in a different PBI report I tested, but the interesting thing is that if you take the original file you sent me, delete the relationship to that lookup table, and then try to add it back in, PBI won’t let you do it because of the circular reference problem. However, the error message that it throws out is not super helpful beyond identifying it as a circular reference:
I think the safer way to accomplish the same thing is to do it in Power Query:
duplicate your fact table
select the column(s) you want to include in your lookup table
remove duplicates
rename table
Enjoyed working with you on this. Interesting data set and application.
Good luck with the project. Give a shout if you run into any other problems.