I am banging my head trying to find this. Most examples I have found are from today looking back 12 months. Sam do you have a video or an example that will show how to calculate, per month, the qty sold for a store based on the opening date? I want to compare the first 12 months of each location against each other to measure how we are doing getting new stores open (we have some stores that opened 10 years ago, we want to see how they did vs hour our new stores are doing). I have a field called ‘Accounts’[OpenDate] that will be the starting date (need to pull the month out). Any help would be appreciated.
Ok yes I have worked up a solution around this scenario in the forum before
This is certainly not easy though and to solve it, there is a bit to it.
We can work on this, but need more information around you model, data, how you want to show the results etc.
All these things matter a lot when looking to solve this.
You’ll see in the forum post that it took a while to get to the end result but it’s definitely possible combining a few formula and model techniques.
We can work on something here, just send through more info.
Chrs
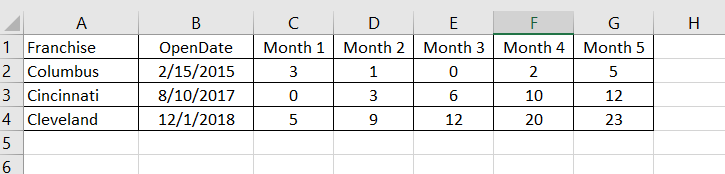
Sam, i am revisiting this topic finally after many years. I looked at your example but I am struggling to transfer to our need. In your example, you had to determine the number of years from first invoice date. In our case, I need to work with both month and year from opening date. I have the opening date field [Contacts.Open-Date]. Each of our franchise locations start on different months and different years. How do determine the 1st month open, 2nd month, etc to the 24th month.
Once i calculate that, i need to then add up the Inspections performed. I already have a Measure that calculates the inspection counts called [Inspections].
The end result would look like this:
Hi @ChrisZimmerman, we’ve noticed that you posted on an inactive and previously tagged solved topic. For more visibility please start a new topic within the forum. You may check this how-to guide for reference - How To Use The Enterprise DNA Support Forum https://forum.enterprisedna.co/t/how-to-use-the-enterprise-dna-support-forum/3951
I am handling this by using Calculated Columns using sample data from SAM samples.
-
Create a Calculated Column to determine first sales for each Category(Customer in my case)
MinOrderDate =
CALCULATE (
MIN ( Sales[OrderDate] ),
ALLEXCEPT ( Sales, Sales[Customer Name Index] )
) -
Determine Month number for all other Sales based on the first Sale of Customer.
MonthOrder =
( YEAR ( Sales[OrderDate] ) - YEAR ( Sales[MinOrderDate] ) ) * 12
+ ( MONTH ( Sales[OrderDate] ) - MONTH ( Sales[MinOrderDate] ) ) + 1 -
Create a Display Column and Sort By MonthOrder created above.
MonthDisplay = "Month " & Sales[MonthOrder]
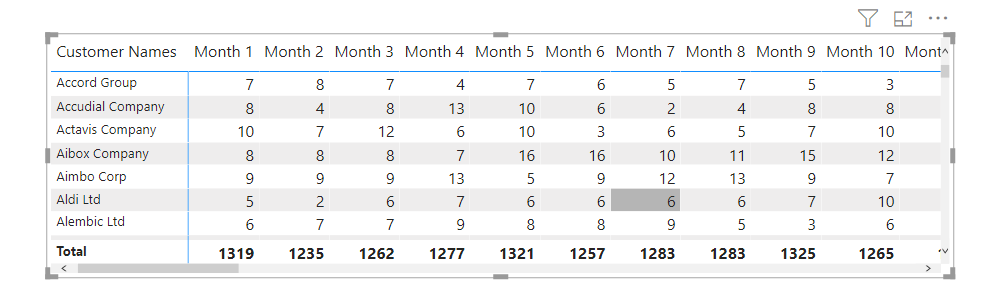
Now you can create any Measure like below for showing the desired value
CountSales = COUNTROWS(Sales)
Put all of them in a Matrix and you should get the desired result.
EDNA_Month_Matrix_Solution.pbix (998.3 KB)
Thanks
Ankit Jain