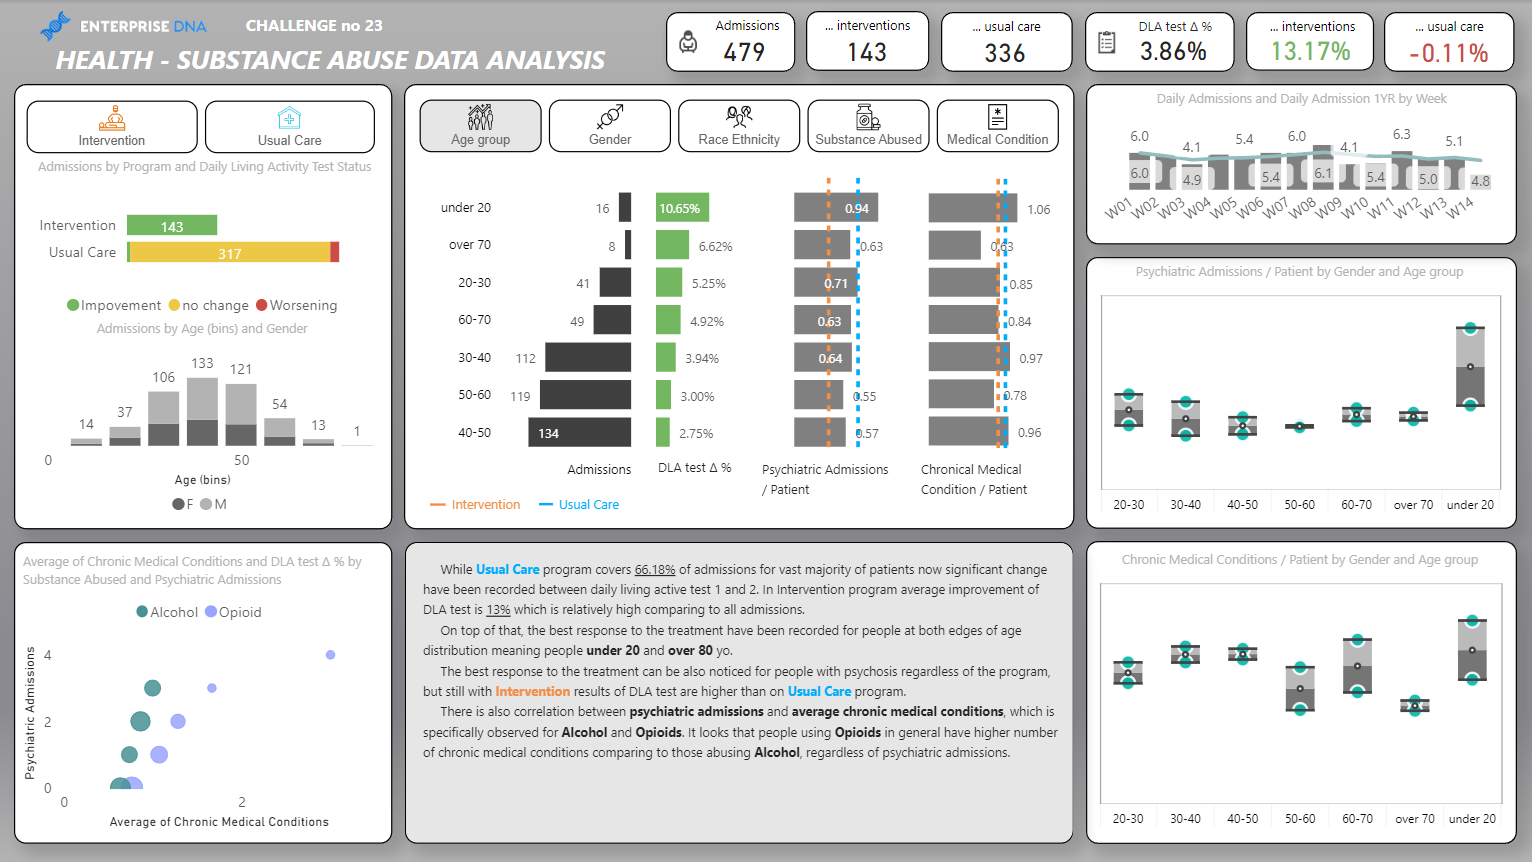
Hi everyone, this is an entry submitted by Philip Giroux via email.
Here’s how Philip Giroux described it:
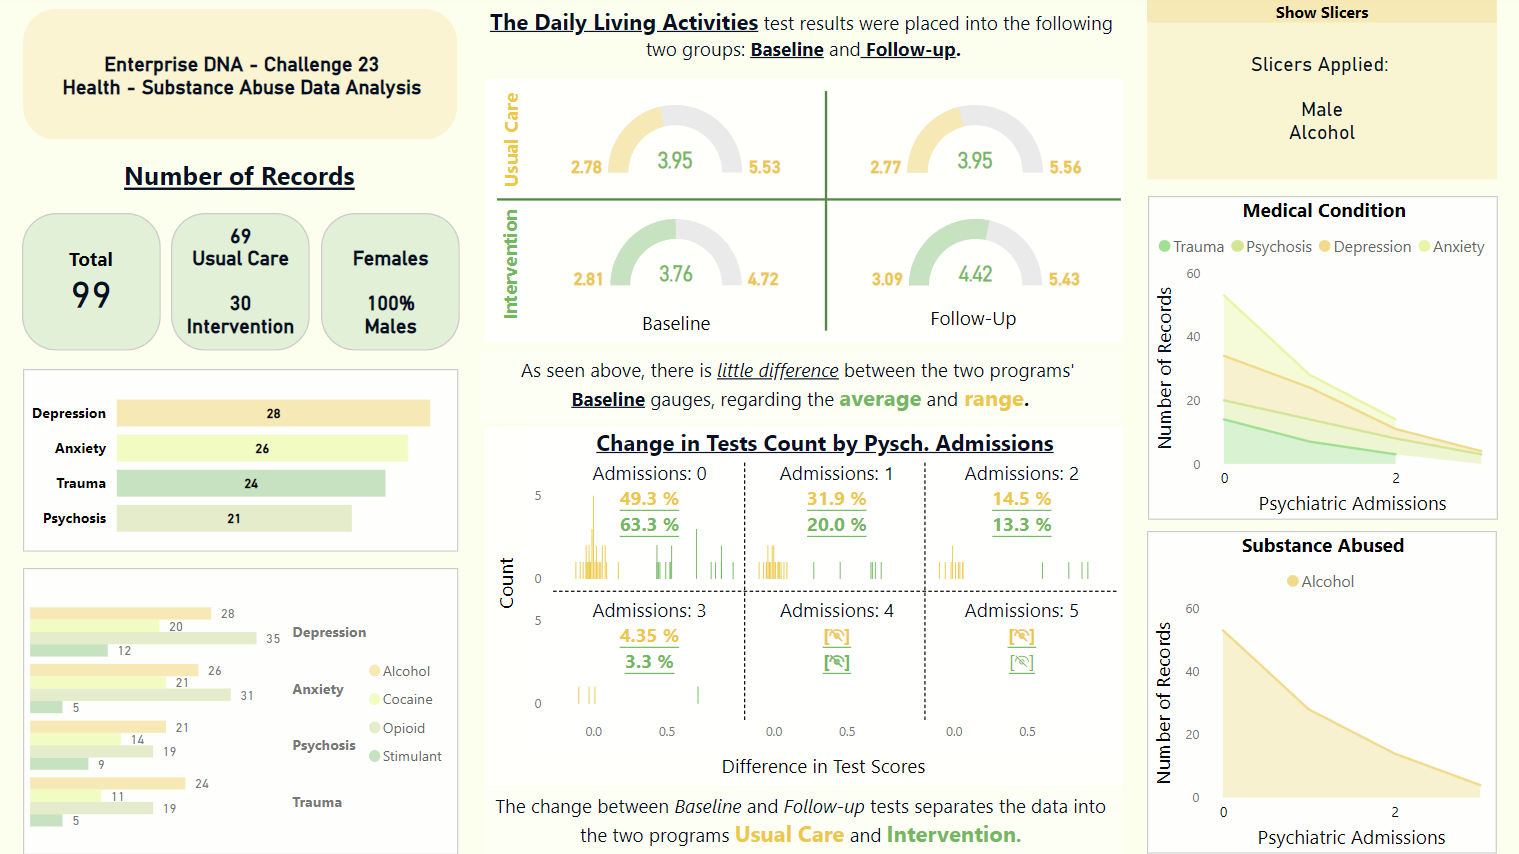
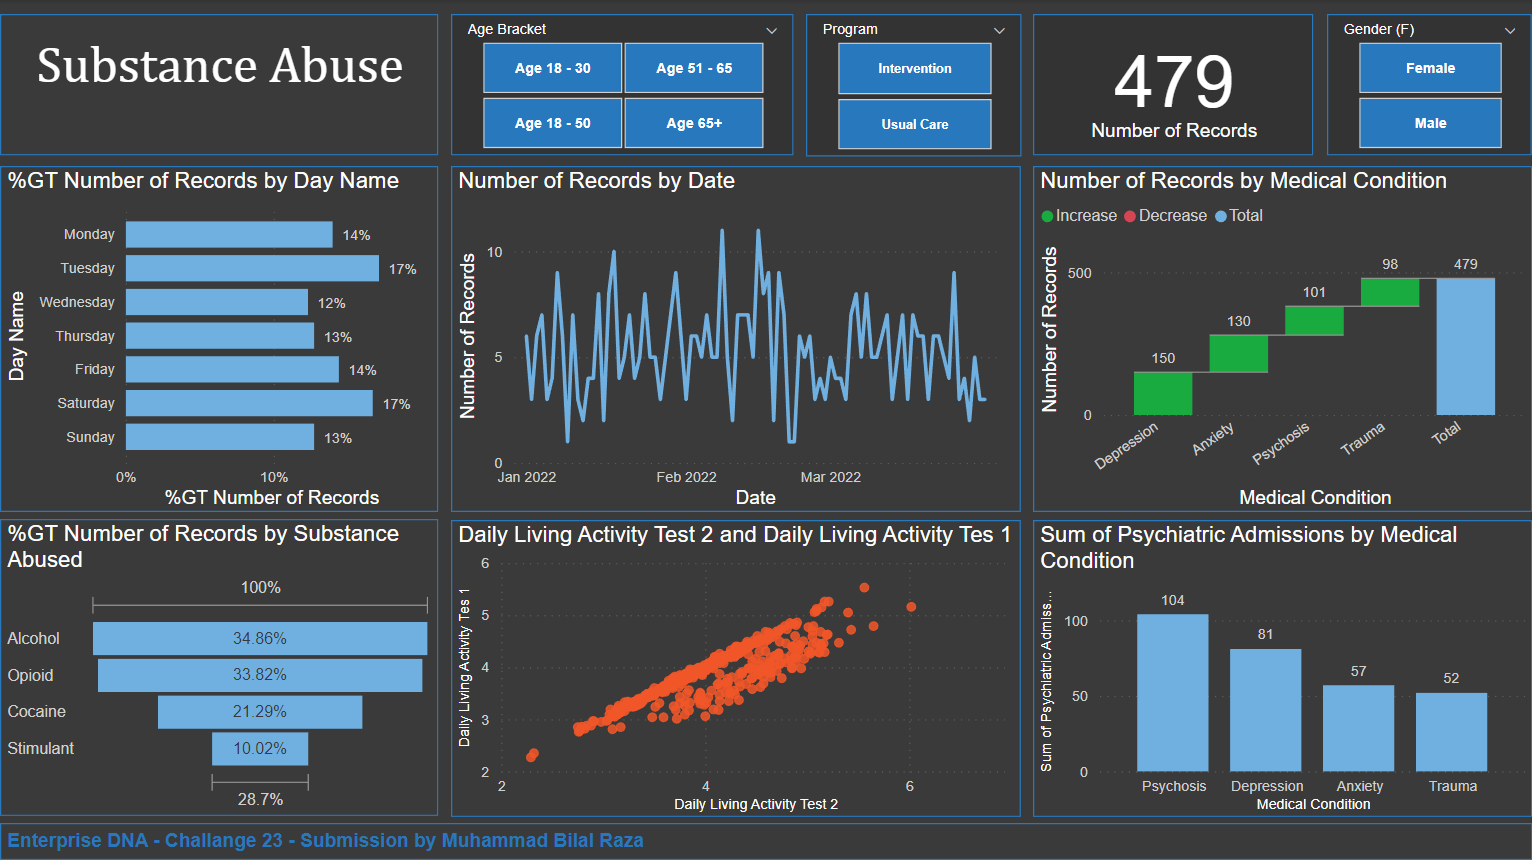
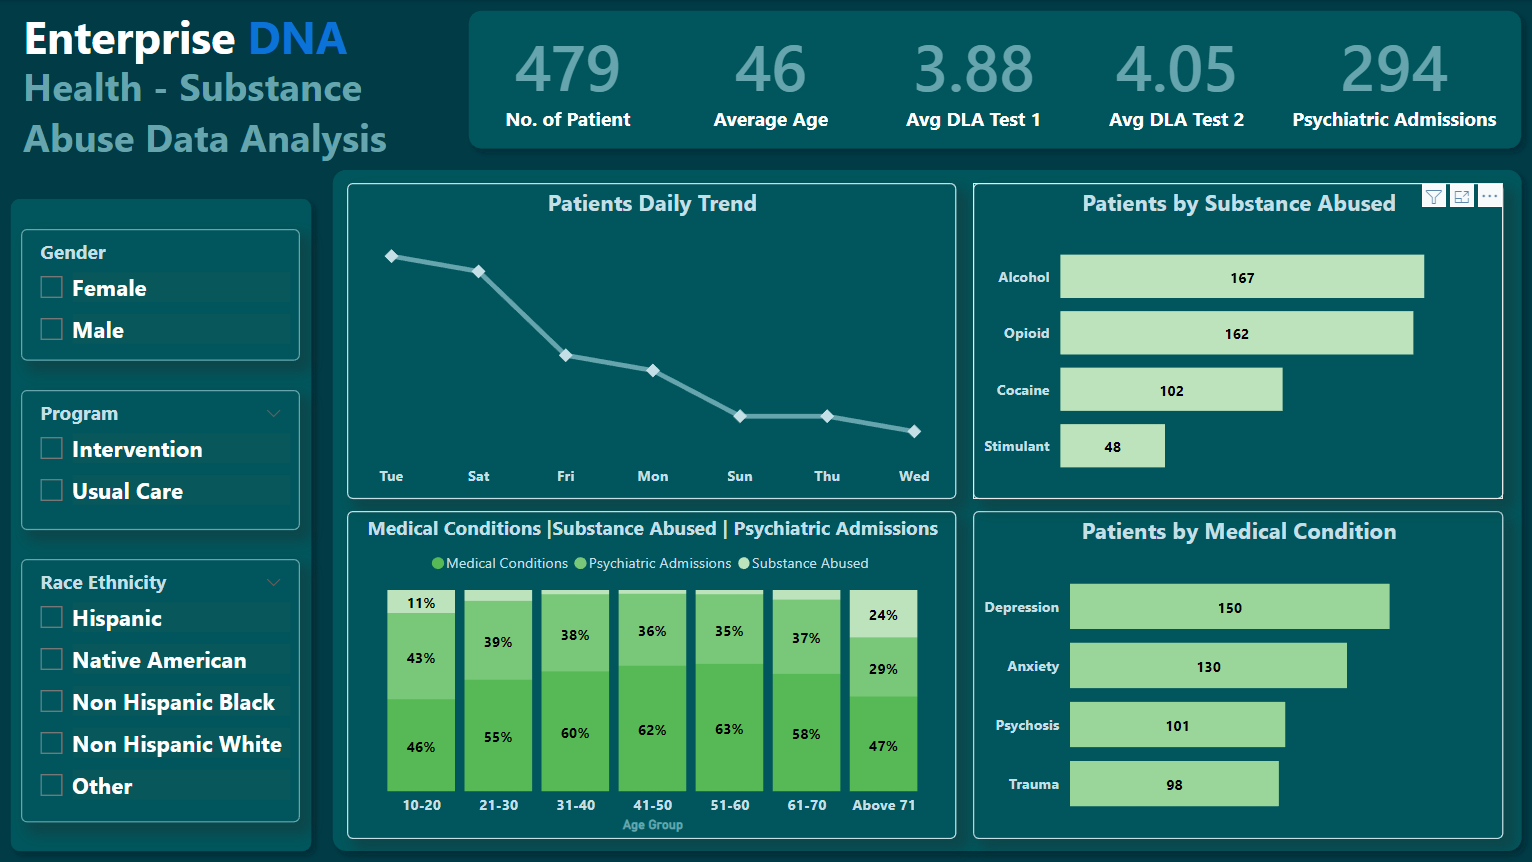
This is for Challenge 23 “Health-Substance Abuse Data Analysis” of Enterprise DNA Challenge. The analysis approach taken was to see if there were any correlation between psychiatric admissions and test scores, or medical condition, or substance abused
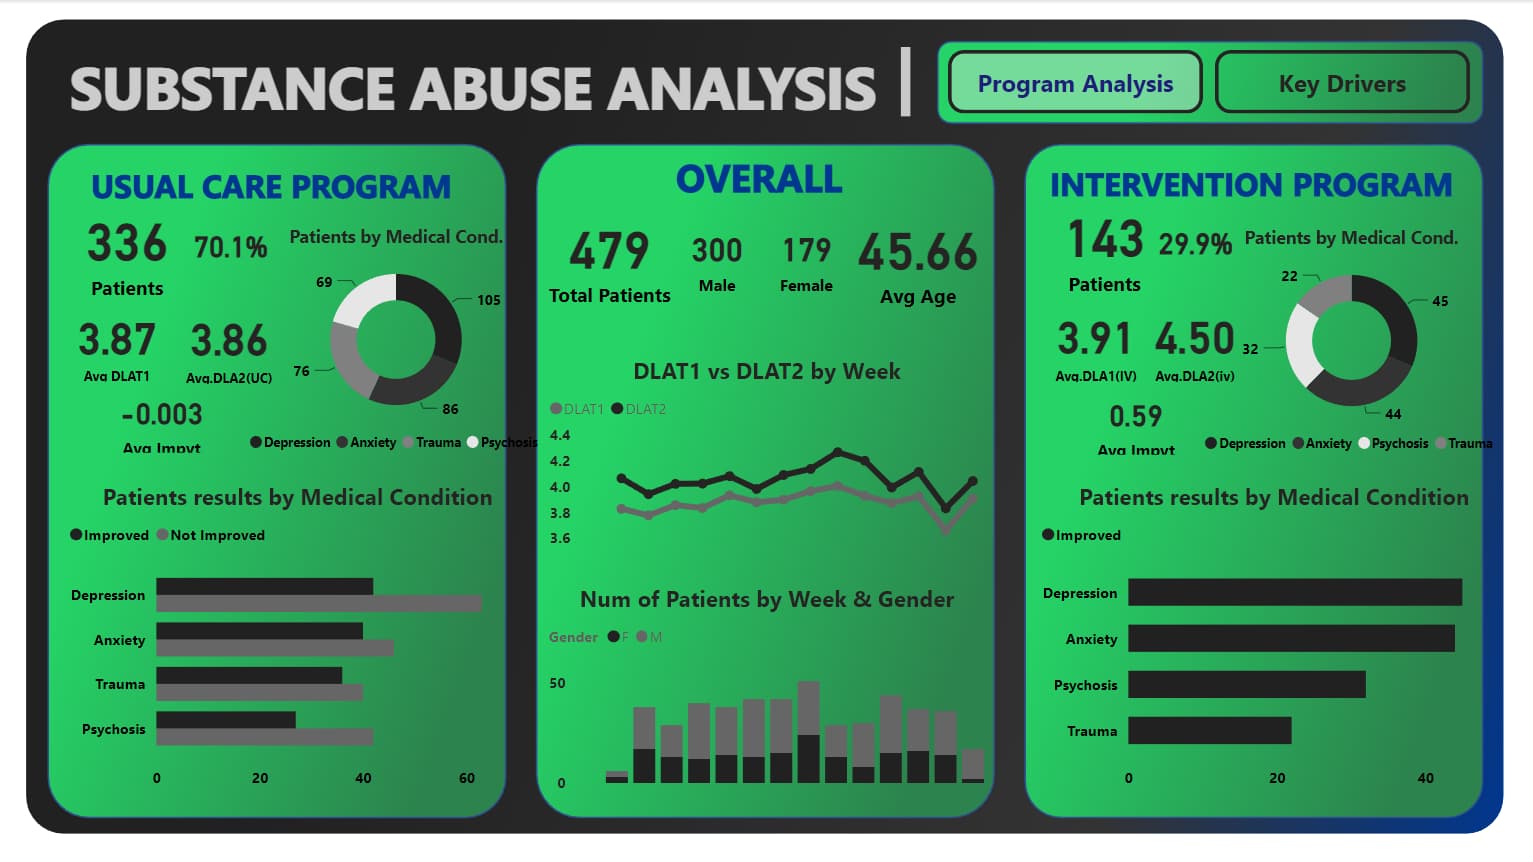
Hi everyone, this is an entry submitted by Oscar Perez via email.
Here’s how Oscar Perez described it:
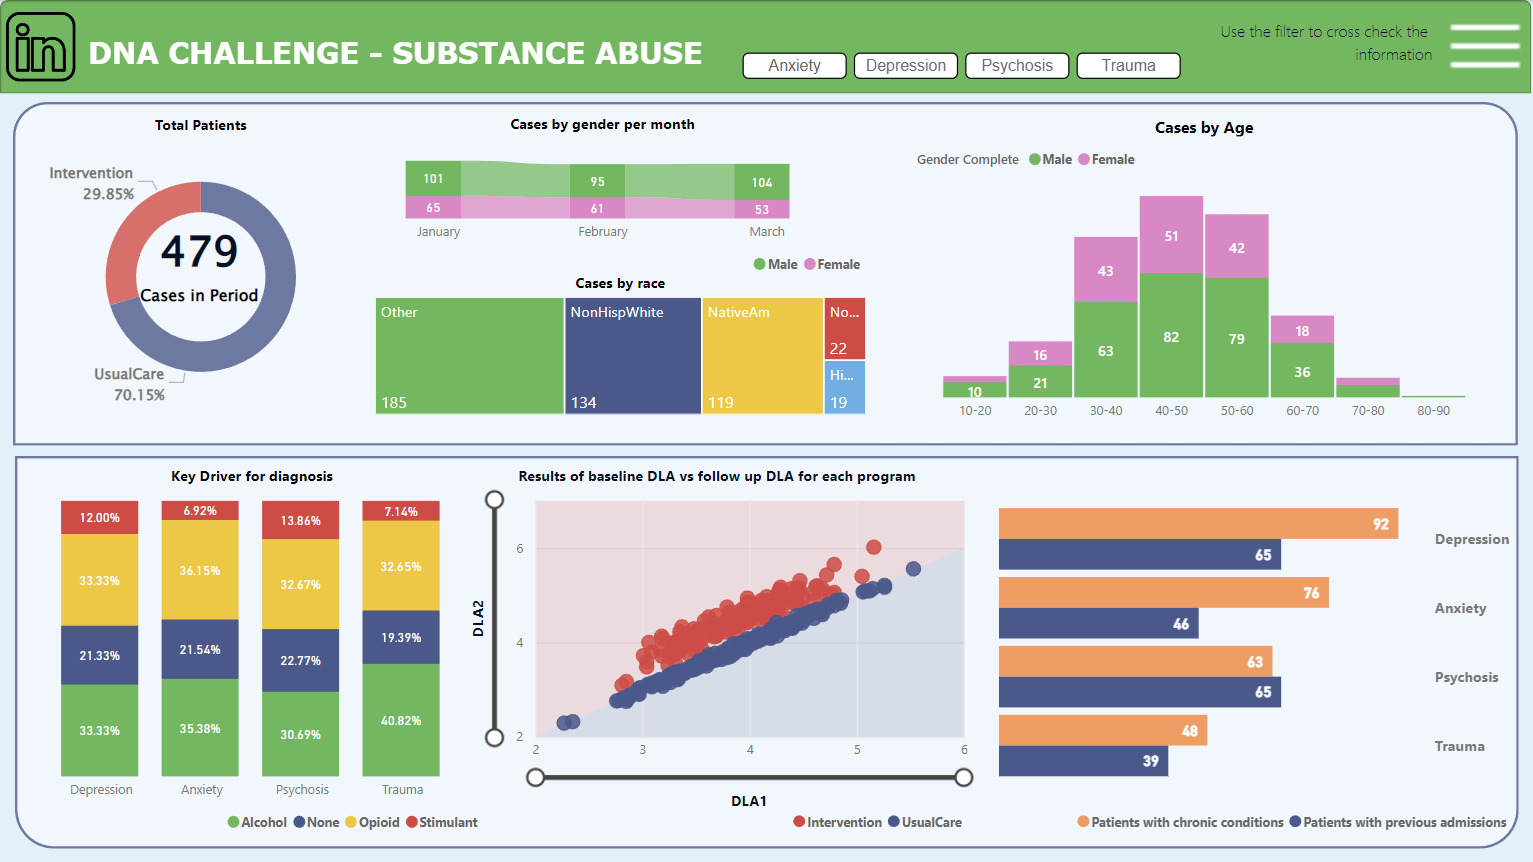
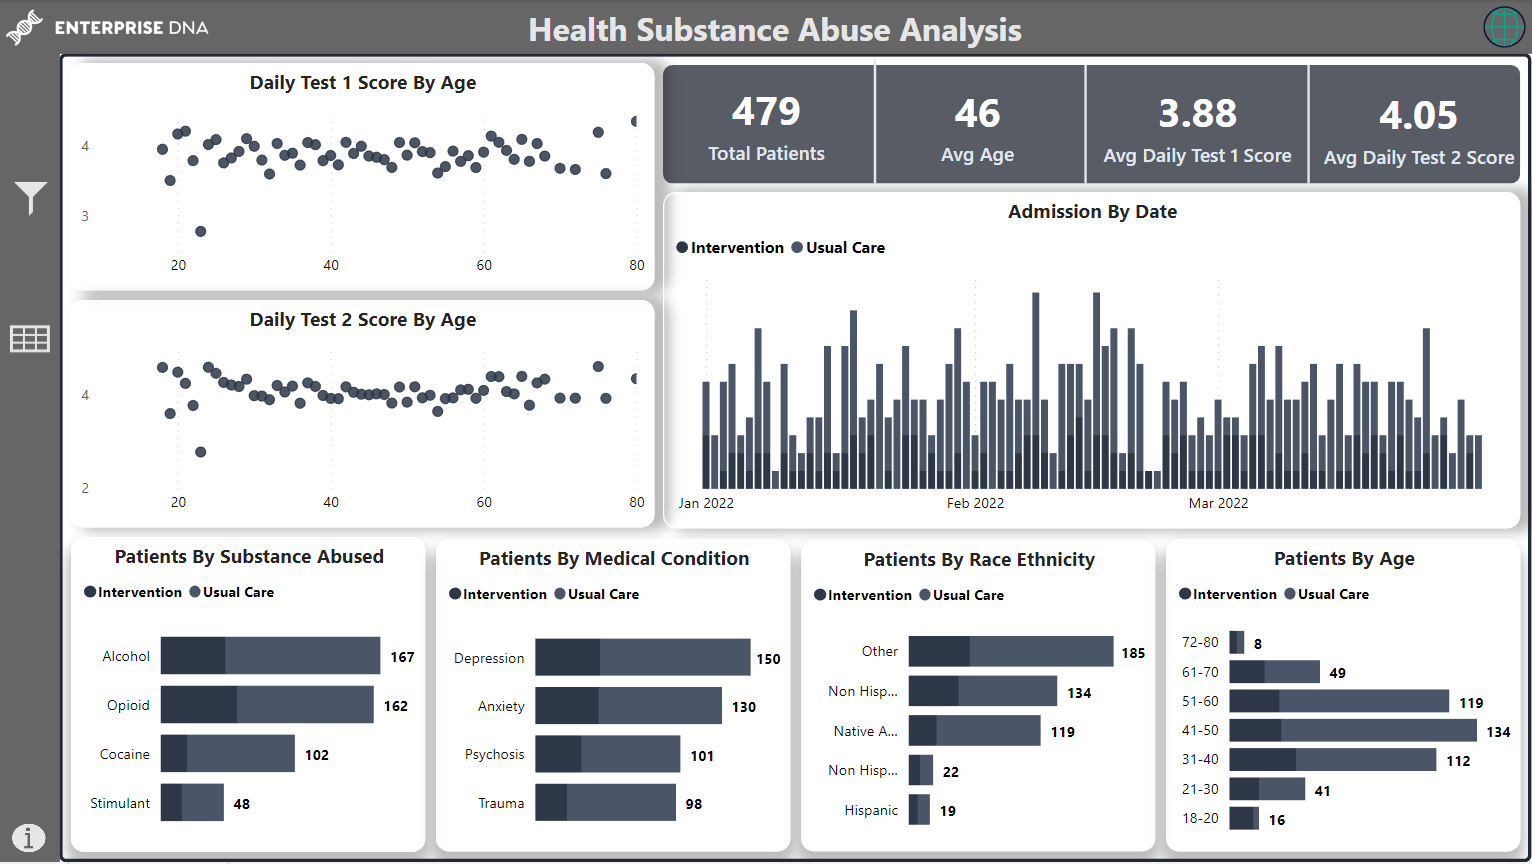
“This is for Challenge 23 “Health-Substance Abuse Data Analysis” of Enterprise DNA Challenge .This is my first entry in an EDNA Challenge, I really liked the dataset. I hope you like it.”
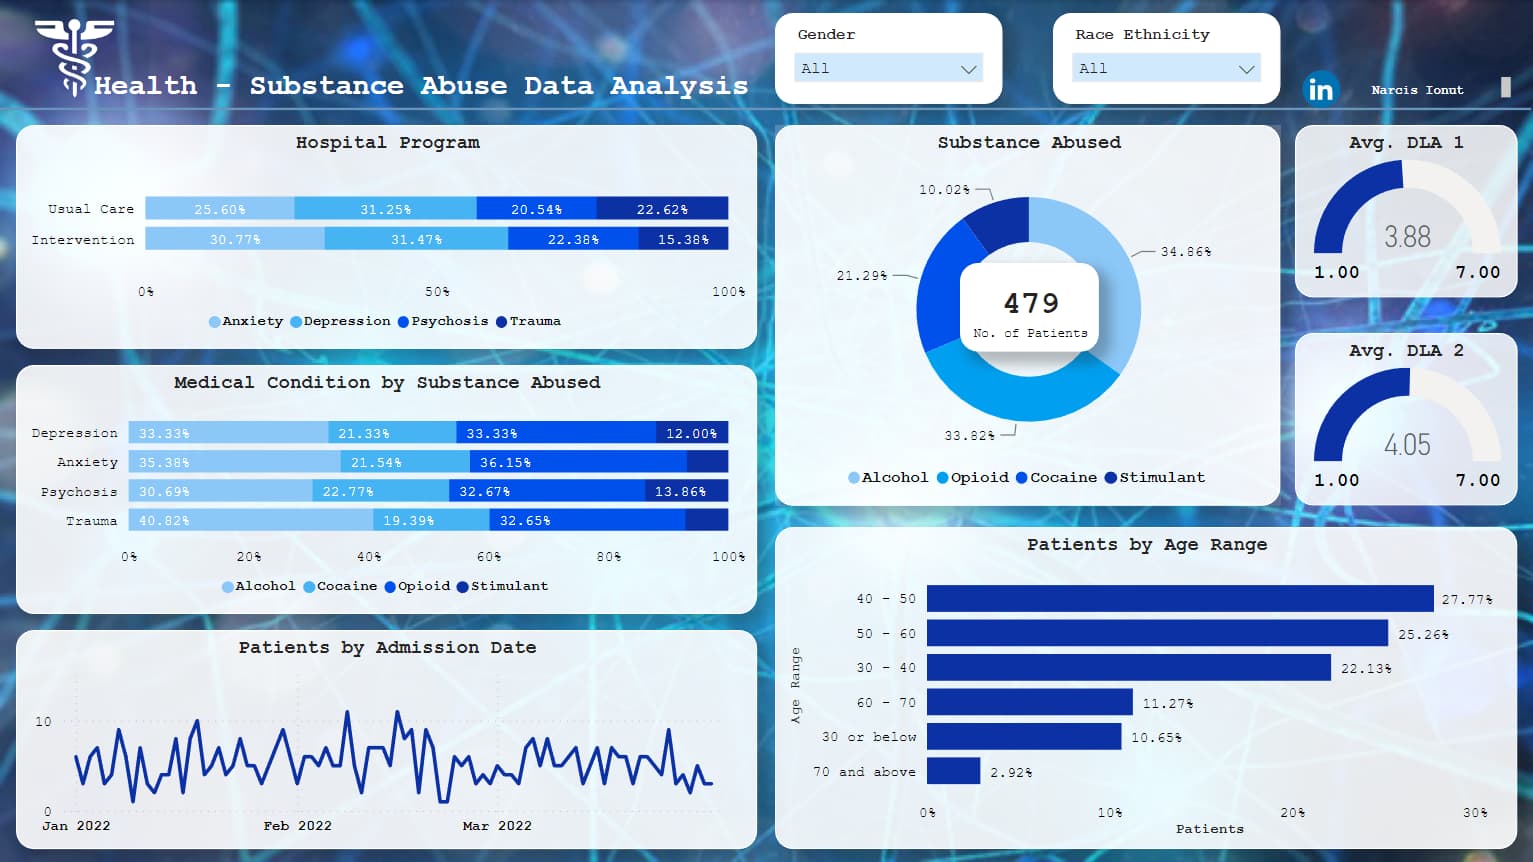
Hi everyone, this is an entry submitted by Muhammd Umair Shahid via email.
Here’s how Muhammd Umair Shahid described it:
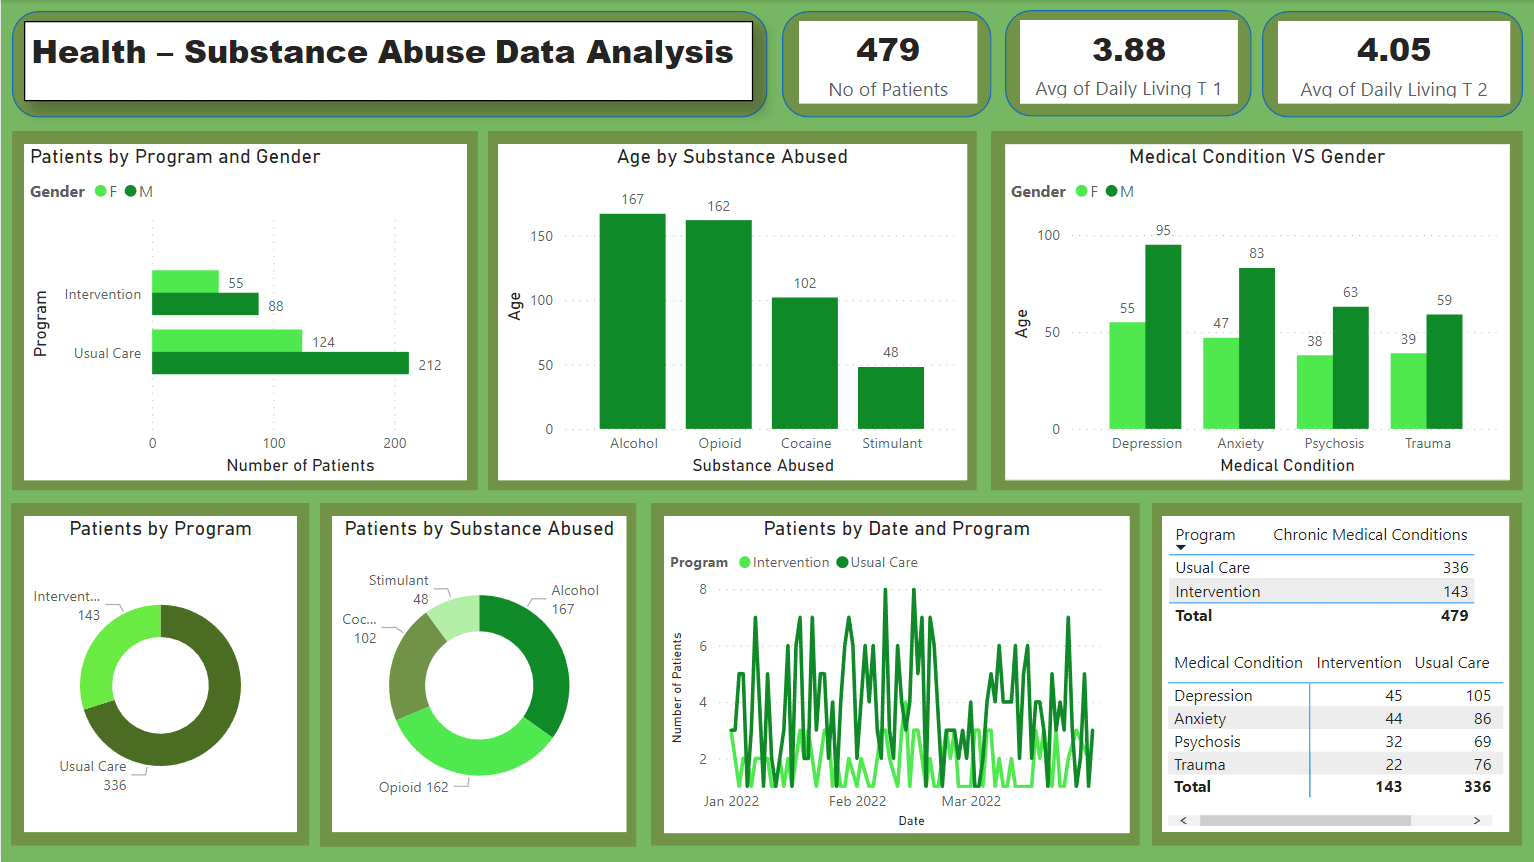
This is for Challenge 23 “Health-Substance Abuse Data Analysis” of Enterprise DNA Challenge . I really enjoyed working with this dataset. I hope you like it.
Hi everyone, this is an entry submitted by Zuzanna Jakubiak via email.
Here’s how Zuzanna Jakubiak described it:
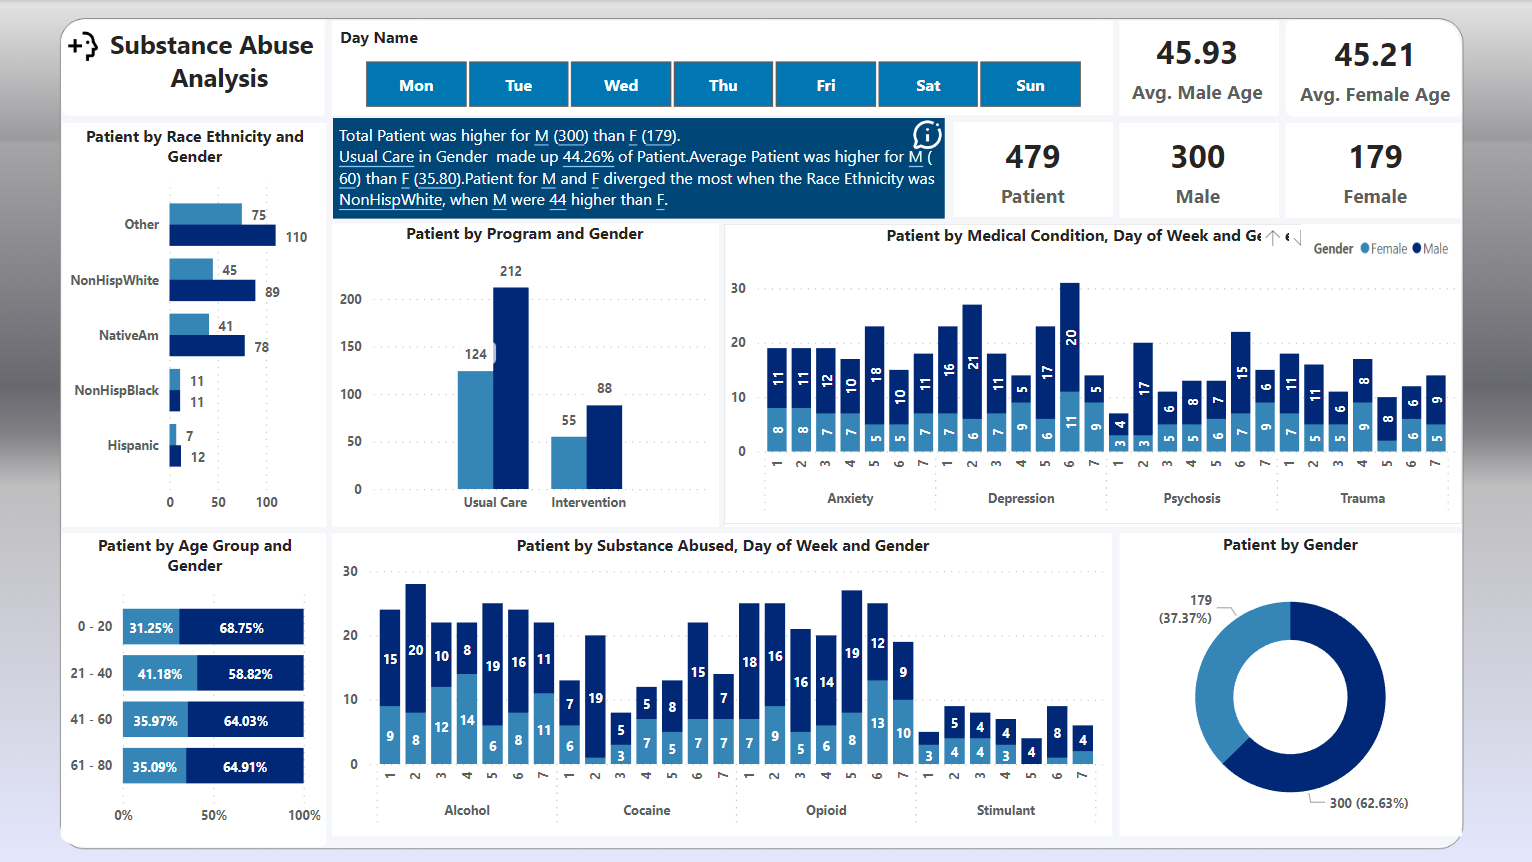
“This is for Challenge 23 “Health-Substance Abuse Data Analysis” of Enterprise DNA Challenge. This is my first time participating. I really enjoyed working with this dataset. I hope you like it.”
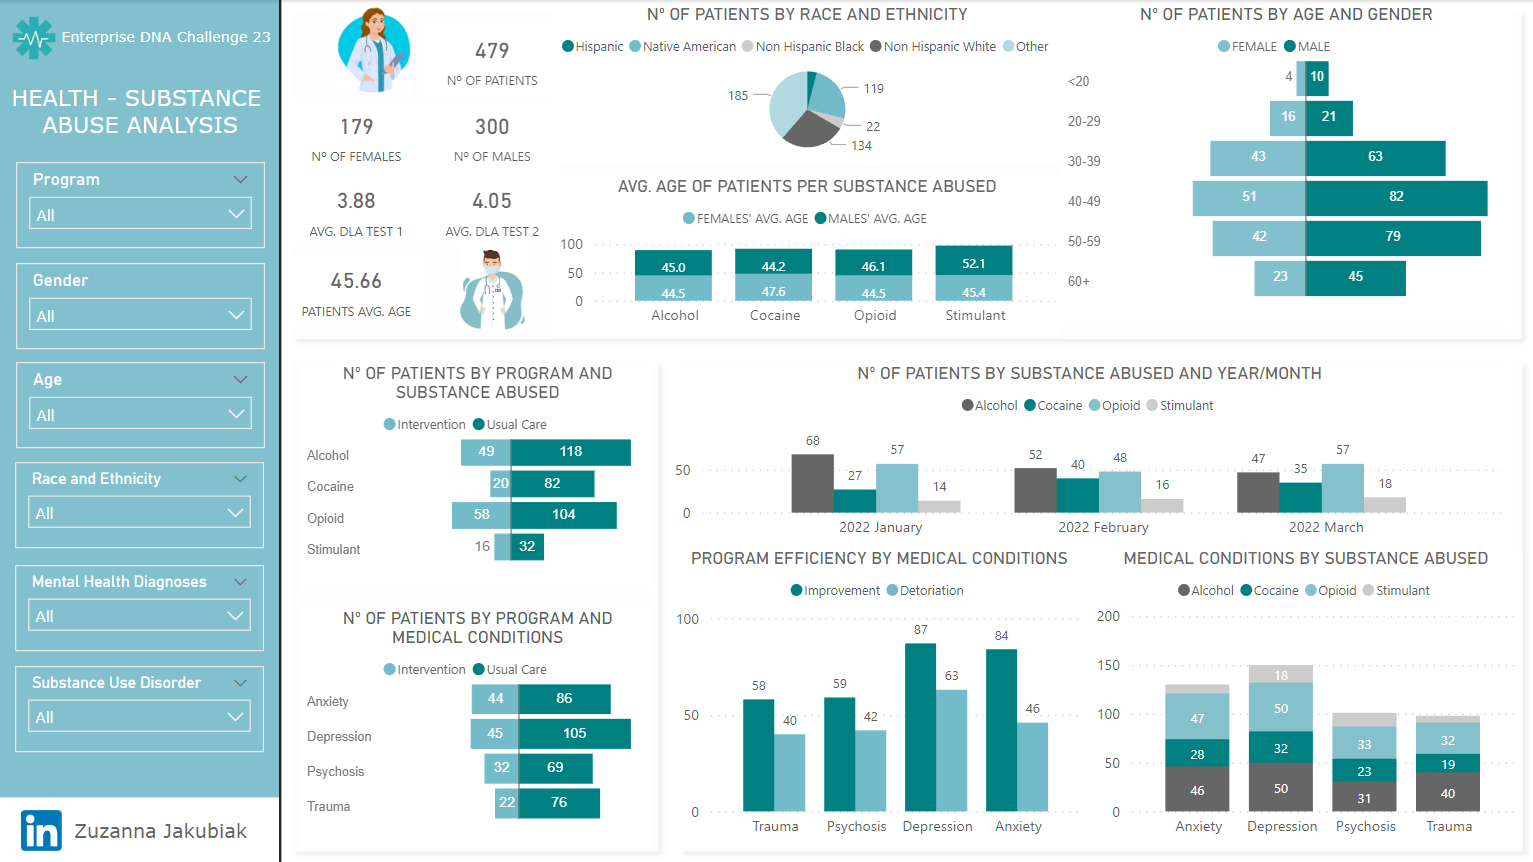
Here’s my submission to the eDNA challenge 23 using Deneb for all visuals and implementing dark mode and light mode.
Special thanks to @MudassirAli helped greatly to create and simplify the PowerPoint backgrounds.
Here are the notes I kept during development:
Goals:
to investigate and produce a 1-page Power BI report in light mode and dark mode
to use Deneb/Vega-Lite for all visuals
to minimize the “normal” Power BI work (data loading and transformations, data modelling, DAX calculations)
Setup:
started with a clean, empty PBIX file (no template or theme)
disabled “Auto date/time” option
disabled “Auto detect relationships” option (both “Import relationships from data sources on first load” and “Autodetect new relationships after data is loaded”)
enabled “Change default visual interaction from cross highlighting to cross filtering”
changed screen size to 2100 x 1200 (not exactly 16x9, but close)
Data Loading:
General:
created a [Blank Query] and used the supplied [Calendar Table_Version August 2022] text file to create a [fxDatesQuery] function; moved to [Parameters and Functions] group
used the [fxDatesQuery] function to create a [Dates] table for 2022-01-02 to 2022-12-31 (full year)
marked [Dates] table as a dates table
used [Metadata Mechanic Pro] external tool to set summarization of all columns in [Dates] table to “None”
chose only select columns from the [Dates] table
set Dates[Date] format to “dd-mmm-yyyy”
loaded [Substance Abuse Programme] Excel sheet; moved to [Staging Queries] group; renamed as [RAW Substance Abuse Programme]; disabled load
Dimension tables:
created reference of [RAW Substance Abuse Programme] as [Ethnicity]
kept only [RaceEthnicity] column, removed other columns, removed duplicates
if [RaceEthnicity] = “Hispanic” then “Hispanic” else if [RaceEthnicity] = “NativeAm” then “Indigenous” else “Other”
added index from 1 as [Ethnicity Key]
created reference of [RAW Substance Abuse Programme] as [Race]
kept only [RaceEthnicity] column, removed other columns, removed duplicates
added column for [Race] using simple PQ formula
if [RaceEthnicity] = “NonHispBlack” then “Black” else if [RaceEthnicity] = “NonHispWhite” then “White” else “Other”
added index from 1 as [Race Key]
created reference of [RAW Substance Abuse Programme] as [Gender]
kept only [Gender] column, renamed to [Gender Code], removed other columns, removed duplicates, added custom column [Gender] to hold gender name
created reference of [RAW Substance Abuse Programme] as [Program]
kept only [Program] column, removed other columns, removed duplicates, added index from 1 as [Program Key]
created reference of [RAW Substance Abuse Programme] as [Mental Health Diagnosis]
kept only [MHDx] column, renamed as [Mental Health Diagnosis], removed other columns, removed duplicates, added index from 1 as [MHDx Key]
created reference of [RAW Substance Abuse Programme] as [Substance Abuse Diagnosis]
kept only [SUDx] column, renamed as [Substance Abuse Diagnosis], removed other columns, removed duplicates, added index from 1 as [SUDx Key]
Fact table:
created reference of [RAW Substance Abuse Programme] as [Patient Data]
duplicated [RaceEthnicity] column as [RaceEthnicity2] (as will need separate relationships for [Race] and [Ethnicity])
renamed [MedDx] column to [Number of Medical Conditions]
renamed [PsychAdmit] column to [Psychiatric Hospital Admissions]
merged with [Ethnicity], kept only [Ethnicity Key] column; removed ‘Patient Data’[RaceEthnicity] column
merged with [Race], kept only [Race Key] column; removed ‘Patient Data’[RaceEthnicity2] column
merged with [Gender], kept only [Gender Key] column; removed ‘Patient Data’[Gender] column
merged with [Program], kept only [Program Key] column; removed ‘Patient Data’[Program] column
merged with [Mental Health Diagnosis], kept only [MHDx Key] column; removed ‘Patient Data’[MHDx] column
merged with [Substance Abuse Diagnosis], kept only [SUDx Key] column; removed ‘Patient Data’[SUDx] column
Measures tables:
created a [Key Measures] table using “Enter Data” in Power BI
created [m1=1] placeholder measure; deleted [Column1]
Supporting tables:
created a [Modes] table using “Enter Data” in Power BI (light, dark)
created a [Metrics] table using “Enter Data” in Power BI (1-8)
created a calculated column to assign metric names (patients, females, males, anxiety diagnosis, depression diagnosis, alcohol diagnosis, opioid diagnosis, stimulant diagnosis)
created a calculated column to assign metric values (from measures)
created a [Last Refresh] table to capture data refresh date and time
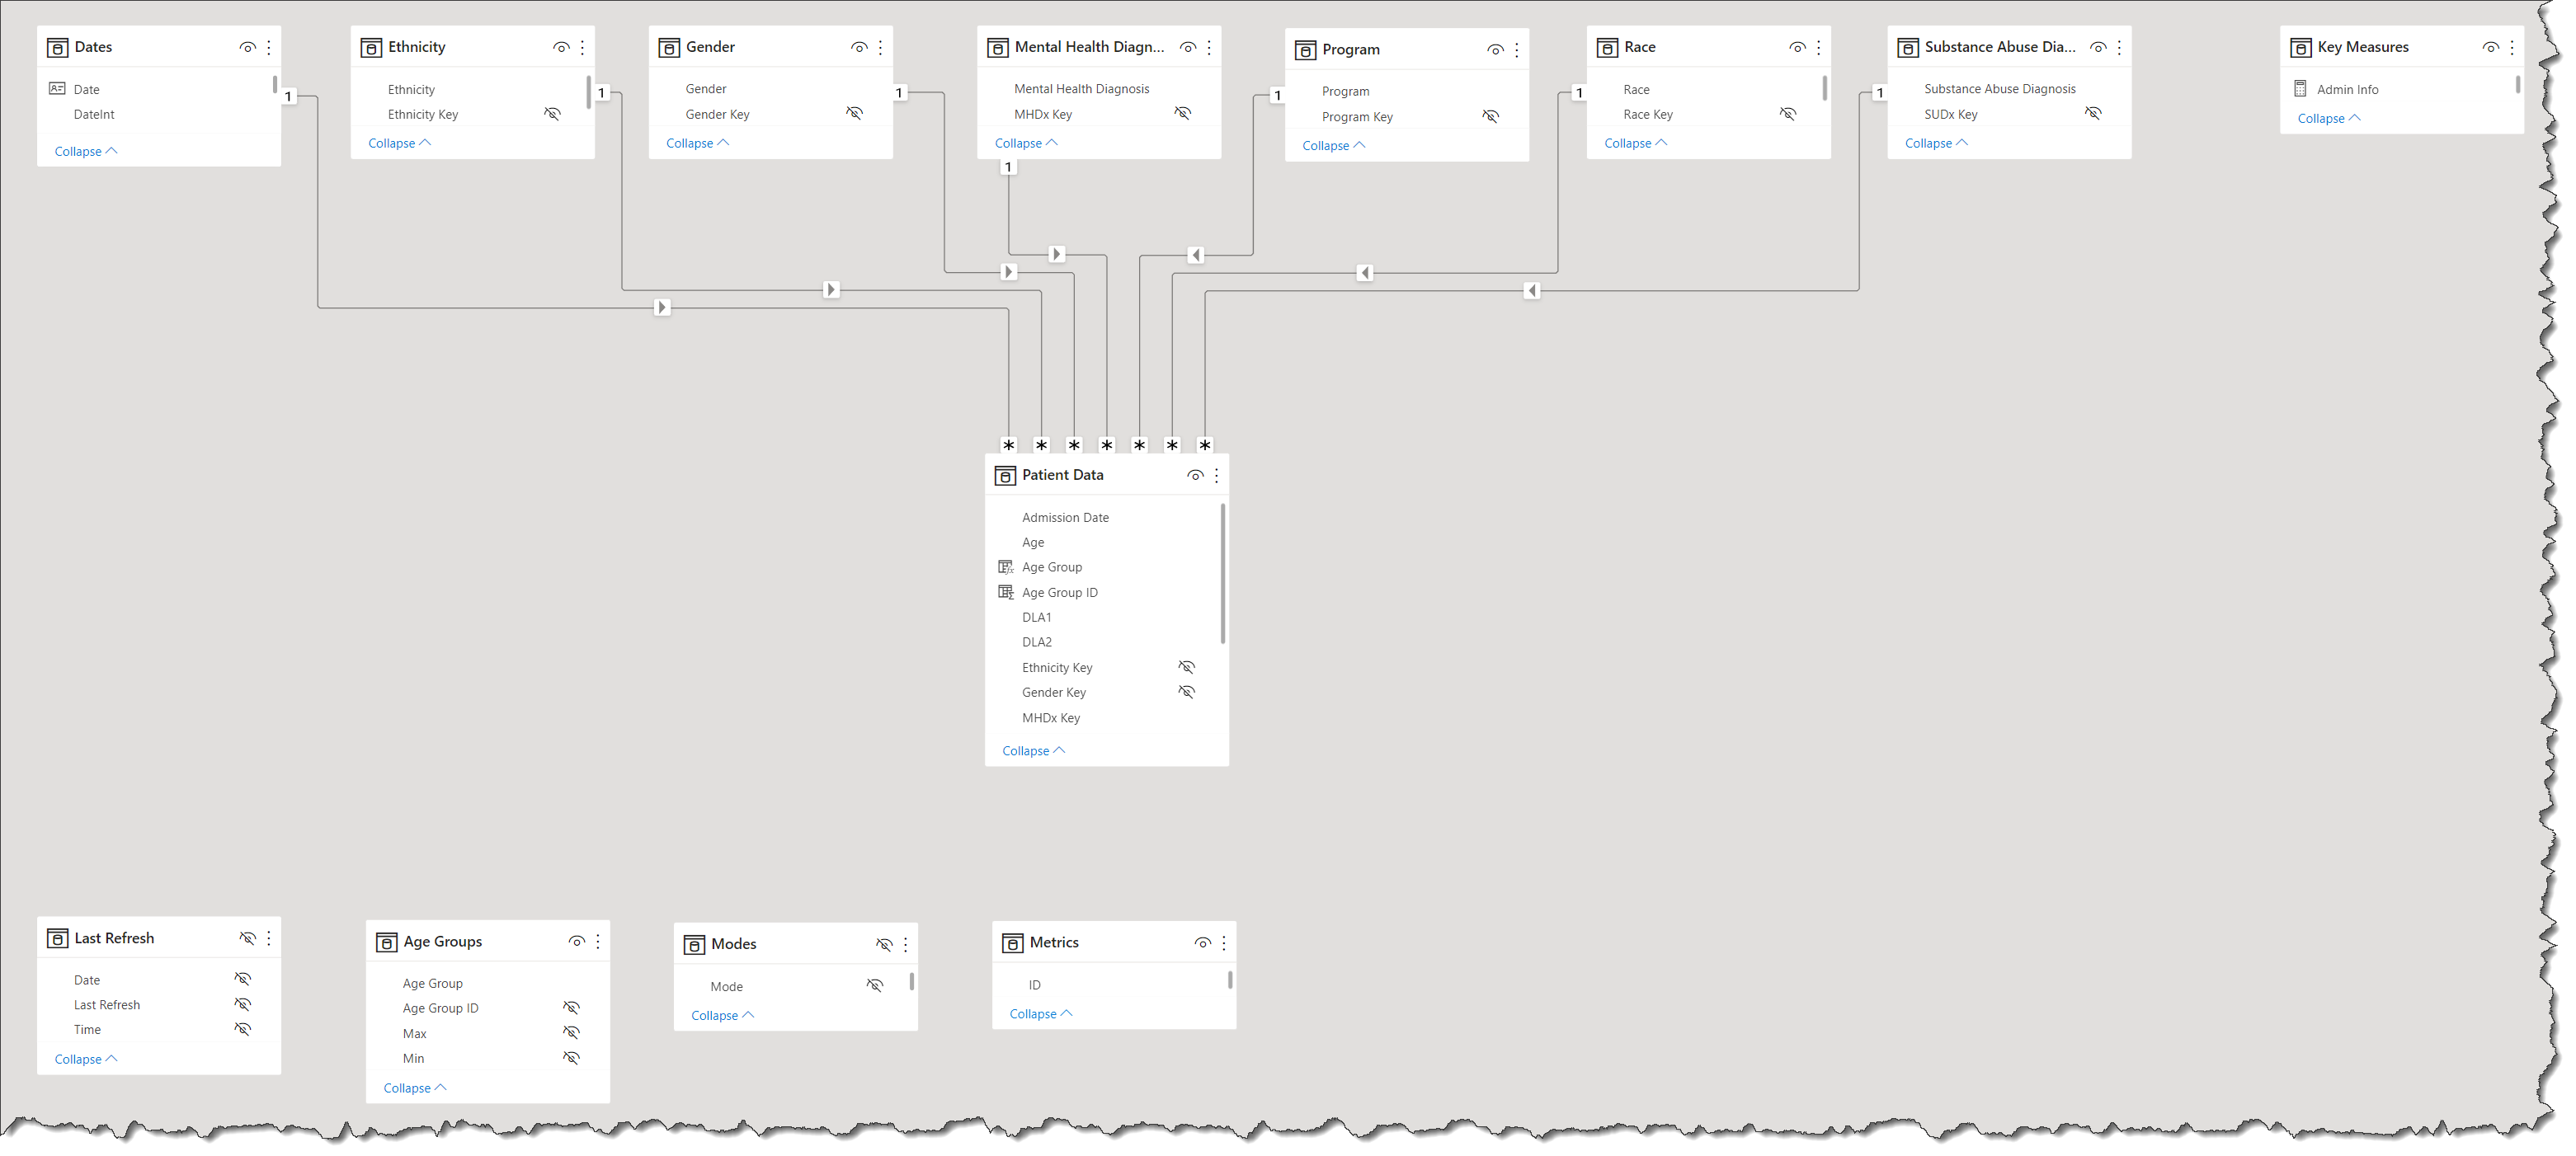
Data Modelling:
arranged tables in waterfall layout (dimensions on top, fact below, measures at right, supporting tables at bottom-left)
used the [Manage Relationships] dialog to create a 1-to-many relationship between Dates[Date] dimension table column and ‘Patient Data’[Admission Date] fact table column
used the [Manage Relationships] dialog to create 1-to-many relationships between dimension tables and fact table
used the [Properties \ Advanced \ Summarize by] drop-down to set the summarization of all columns to “None”
used the [Fields] pane to hide all “Key” columns
used the [Fields] pane to hide the “Age Group ID”, “Min”, and “Max” columns in the [Age Groups] table
used the [Fields] pane to hide the Ethnicity[RaceEthnicity] and Race[RaceEthnicity] columns
created simple measures for patients, females, males, interventions, alcohol abuse, opioid abuse, stimulant abuse, anxiety diagnosis, depression diagnosis
created simple measures for report administration info (e.g., ID, version, version date, etc.)
created simple measures for mode (light, dark), text colour, shadow colour
Visualizations:
General:
chose Pantone Color of the Year 2020 (dark blue, HEX #0F4C81) as a base colour
created [Text Colour] measure to return the HEX code for white if dark mode, darkest blue if light mode
Text Color =
IF( [Mode] = "Dark", "#FFFFFF", "#051B2E" )
Backgrounds:
used #0F4C81 in Enterprise DNA Analyst Hub \ Colour Theme Generator \ Colours Fan to generate 10-colour HEX codes; copied and pasted 8 darkest colours into a JSON theme file and set the Power BI file to this colour theme
used PowerPoint to create light and dark backgrounds (light white, dark using darkest blue in colour theme)
set size of PowerPoint slides to 2100 px by 1200 px
on light slide inserted centered rounded rectangle and set shadow to lower-right; duplicated rounded rectangle and set shadow to upper-left; overlapped rectangles; set colour to white and shadow to darkest blue
on dark slide inserted centered rounded rectangle and set shadow to lower-right; duplicated rounded rectangle and set shadow to upper-left; overlapped rectangles; set colour to darkest blue in colour theme and shadow to white
used PowerPoint to create 2 images for light mode and dark mode; set colour of dark mode (crescent moon) icon to darkest blue; set line colour of light mode (sun) icon to white and fill colour to darkest blue; used image actions for simple navigation between light and dark pages
used rectangle shape for title in top-left (using [Text Colour] measure for font colour; vertical top alignment; padding 4px top, 4px right, 4px bottom, 10px left)
used rectangle shape for admin info in lower-left (using [Text Colour] measure for font colour; horizontal alignment left, vertical alignment bottom; padding 4px top, 4px right, 4px bottom, 6px left)
used rectangle shape for last refresh in lower-right (using [Text Colour] measure for font colour; horizontal alignment right, vertical alignment bottom; padding 4px top, 6px right, 4px bottom, 4px left)
used 2 images (1 per page) to allow navigation between light mode and dark mode pages; turned off tooltips
Deneb Visuals:
General:
used as much parameterization as possible to ease development and improve consistency
although not a “true” light mode/dark mode rendering, only 1 small change was required after cut-and-paste to dark mode page: set [_mode] parameter to “dark”
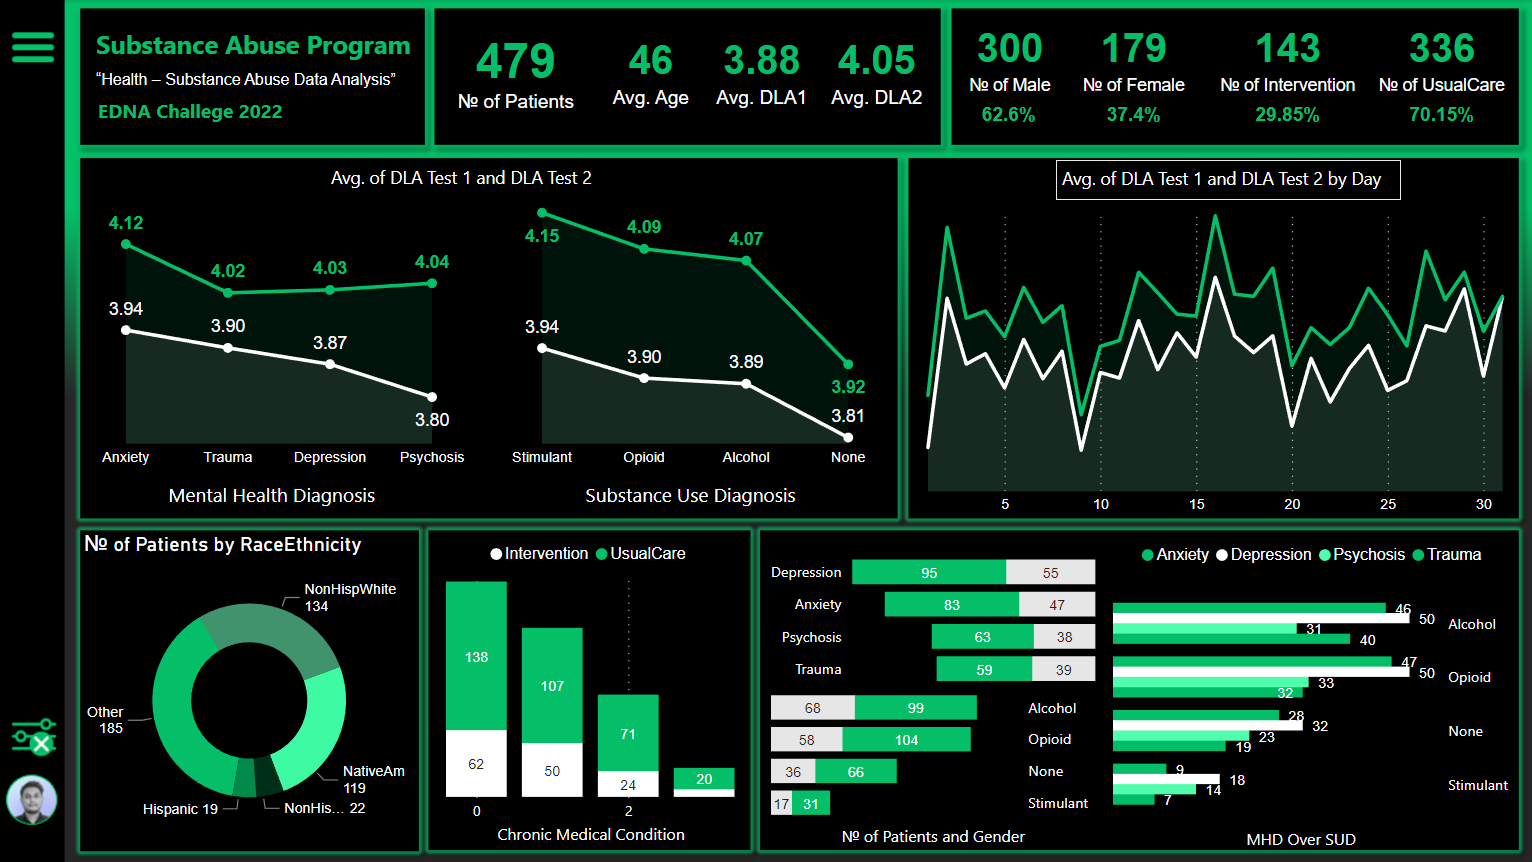
Patient Metrics:
layered specifications (3) for the background of the “card” (a bar chart of fixed size with gradient colours and rounded corners, the metric name (text mark), and the metric value (text mark)
Patient Interventions:
layered specifications (4) for the background of the “donut” (100% arc mark), the percent arc with gradient colours and rounded cornders, the percent value (text mark), and the program name (text mark)
Patient Pyramid by Gender:
horizontally concatenation of 3 views: bar mark specification in negative direction for female, text mark specification for common y-axis scale, bar mark specification for male
Patient Characteristic Breakdown:
used a “repeat” view composition to produce “full multiples” column charts (a full breakdown of the dataset for each of 4 different characteristics: ethnicity, race, program, substance abused)
Patient Admissions by Program:
used a standard line chart but added “basis” interpolate property for smoothing
added detection of mouse hover to display in full colour the line currently being “hovered-over” while greying-out the remaining line
added layered circle mark and text mark for endpoint designation
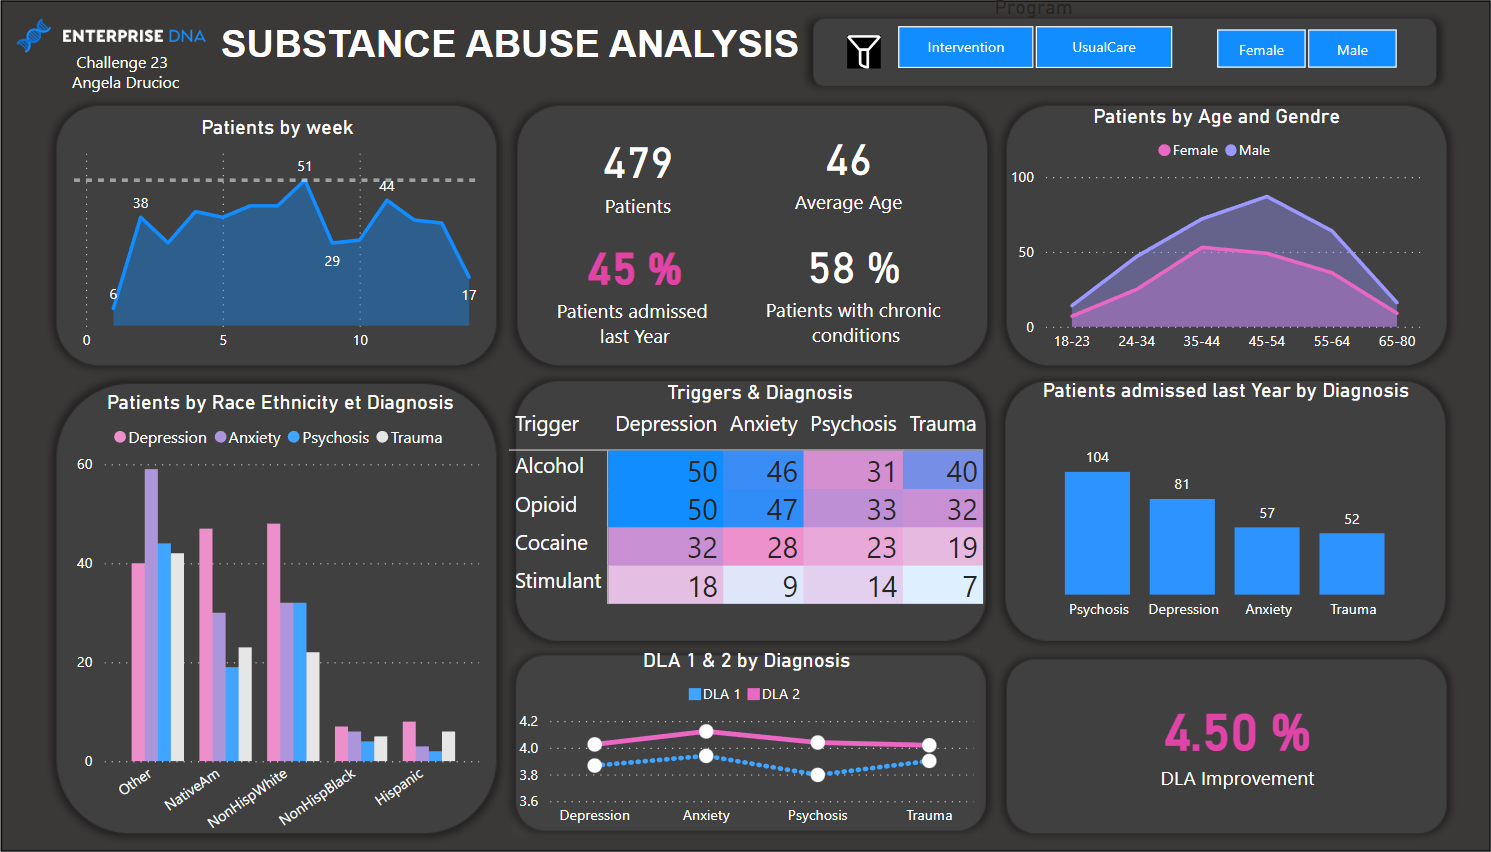
Hi everyone, this is an entry submitted by Angela Drucioc via email.
Here’s how Angela Drucioc described it:
“This is one of my first’s experiences in Power BI and the first challenge as well.
Some weeks ago, I was looking for inspirations and I found some amazing dashboards by Enterprise DNA. This is how I found this challenge. I hope you like it.”
Hi everyone, this is an entry submitted by Udochukwu Okoye via email.
Here’s how Udochukwu Okoye described it:
“This is one of my first’s experiences in Power BI and the first challenge as well.
This is one of my first’s experiences in Power BI and the first challenge as well. I found the dataset very intriguing. I hope you like it
Hi everyone, this is an entry submitted by Sathish Kumar via email.
Here’s how Sathish Kumar described it:
This is my entry for Enterprise DNA Challenge 23. I found the dataset very interesting and liked to work on it. Please provide me with feedback if you wish. I hope you like it