Hi everyone, this is an entry submitted by Hanna Sudwoj sent to us via email.
You may view the full report here:
Hanna Sudwoj
Please feel free to give Hanna Sudwoj your feedback on his report.
Hi everyone, this is an entry submitted by Hanna Sudwoj sent to us via email.
You may view the full report here:
Hanna Sudwoj
Please feel free to give Hanna Sudwoj your feedback on his report.
Hi everyone, this is an entry submitted by Thoraya Mahfouz sent to us via email.
You may view the full report here:
Thoraya
Please feel free to give Thoraya Mahfouz your feedback on his report.
Hi everyone, this is an entry submitted by Mahmoud Sallam sent to us via email.
You may view the full report here:
Mahmoud Sallam
Please feel free to give Mahmoud Sallam your feedback on his report.
Hi everyone, this is an entry submitted by Ashir Kaleem sent to us via email.
You may view the full report here:
Ashir Kaleem
Please feel free to give Ashir Kaleem your feedback on his report.
Hi everyone, this is an entry submitted by Vida Vaitkunaite sent to us via email.
You may view the full report here:
Vida Vaikunaite
Please feel free to give Vida Vaikunaite your feedback on his report.
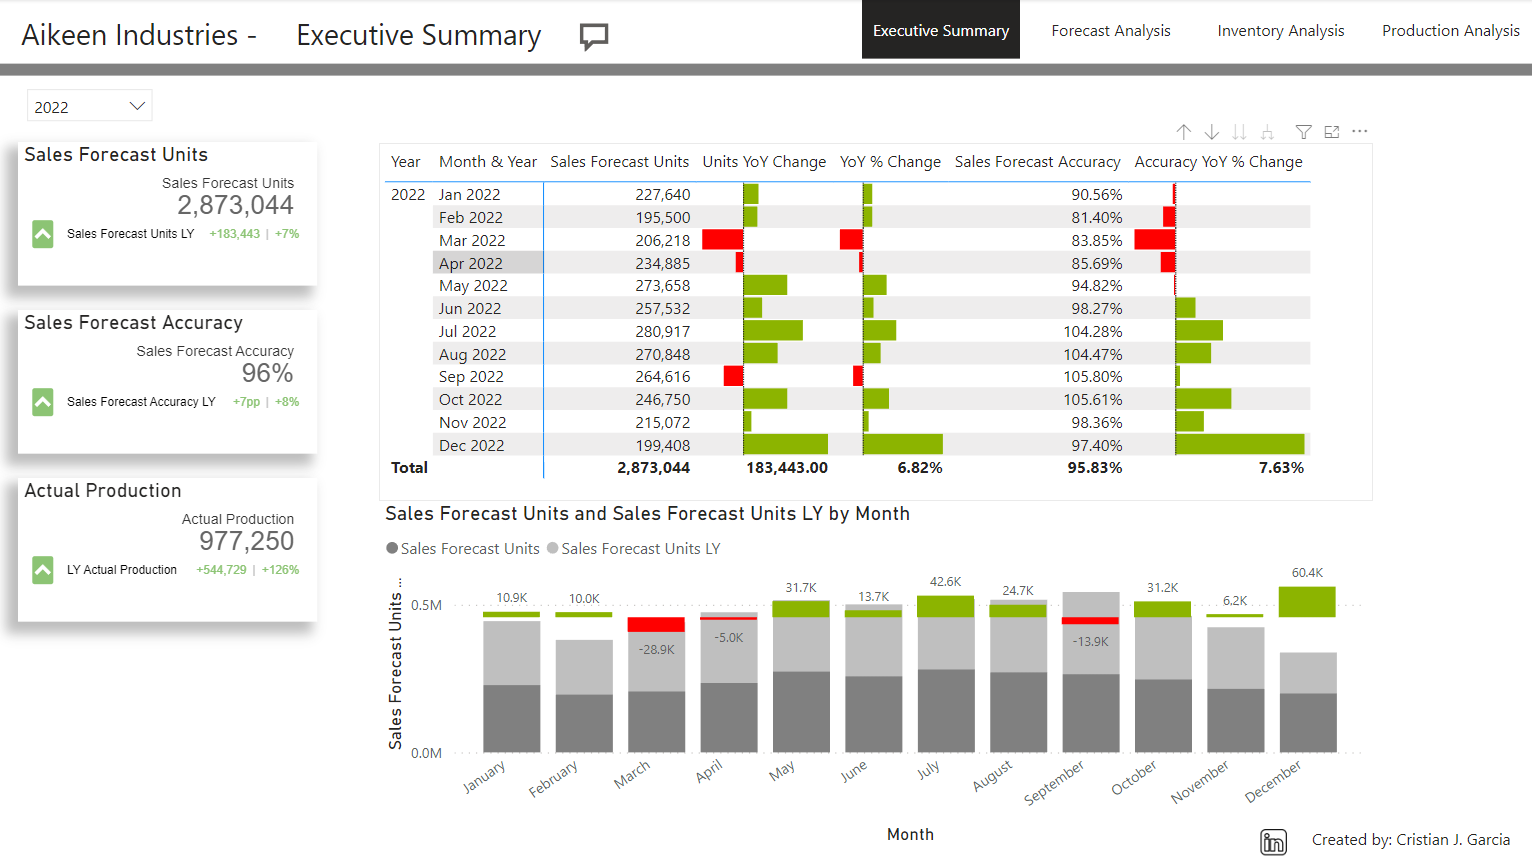
Hi everyone, this is an entry submitted by Cristian Garcia sent to us via email.
You may view the full report here:
Cristian Garcia
Please feel free to give Cristian Garcia your feedback on his report.
Hi everyone, this is an entry submitted by Solar Zhu sent to us via email.
You may view the full report here:
Solar Zhu
Please feel free to give Solar Zhu your feedback on his report.
Hi everyone, this is an entry submitted by Kumar Gaurav sent to us via email.
You may view the full report here:
Kumar Gaurav
Please feel free to give Kumar Gaurav your feedback on his report.
Hi everyone, this is an entry submitted by Kiruba Selvi sent to us via email.
You may view the full report here:
Kiruba Selvi
Please feel free to give Kiruba Selvi your feedback on his report.
Hi everyone, this is an entry submitted by Veera Ambrosio sent to us via email.
You may view the full report here:
Vera Ambrosio
Please feel free to give Veera Ambarsio your feedback on his report.
Hi everyone,
Below I explain the process I followed to develop the Sales and Production Analysis report for this month’s challenge.
In the process of developing this report I have followed the following phases:
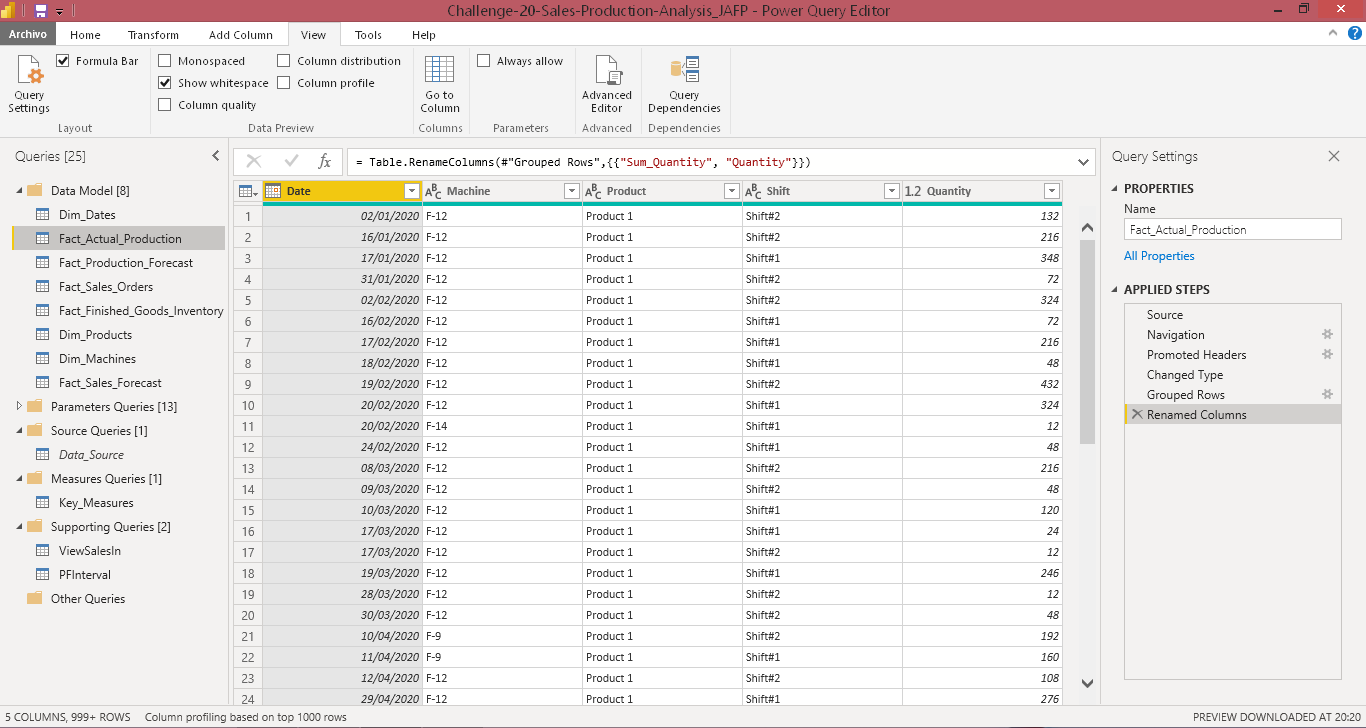
• Fact_Sales_Orders : Sales fact table for the next 14 days.
The Unpivot other columns option is performed by selecting the Product and Quantity columns.
In this case, it could have eliminated the records with Quantity = 0 so that it would only show the days with sales, but finally opted to show all the records of the 14 days.
• Fact_Finished_Goods_Inventory: Fact table of Finished Goods Inventory.
• Dim_Products : Products dimension table.
Duplicate records are removed.
• Dim_Machines: Machine dimension table.
Duplicate records are removed.
• Dim_Dates: EDNA Date dimension table.
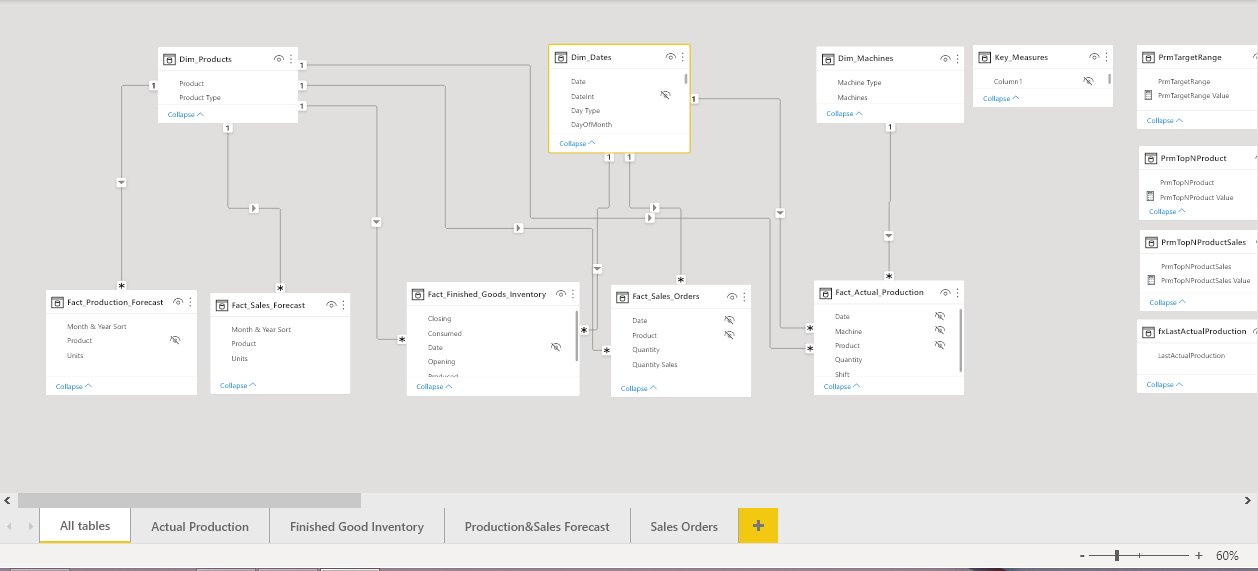
• I have followed the Star Scheme to model the data.
For the Fact_Production_Forecast and Fact_Sales_Orders tables, a relationship with the Dates table has not been created. When creating the DAX measures, the TREATAS function is used to create the relationship virtually.
• For its graphical representation I have used the cascade design.
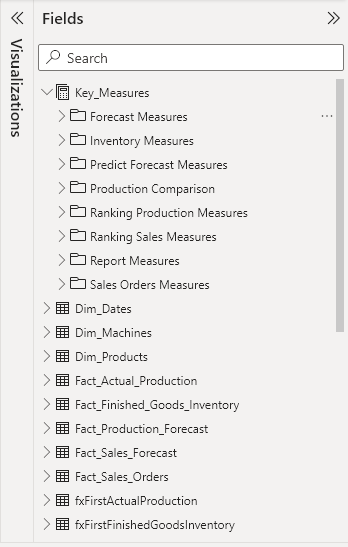
• All measures have been organized in folders within the Key Measures table.
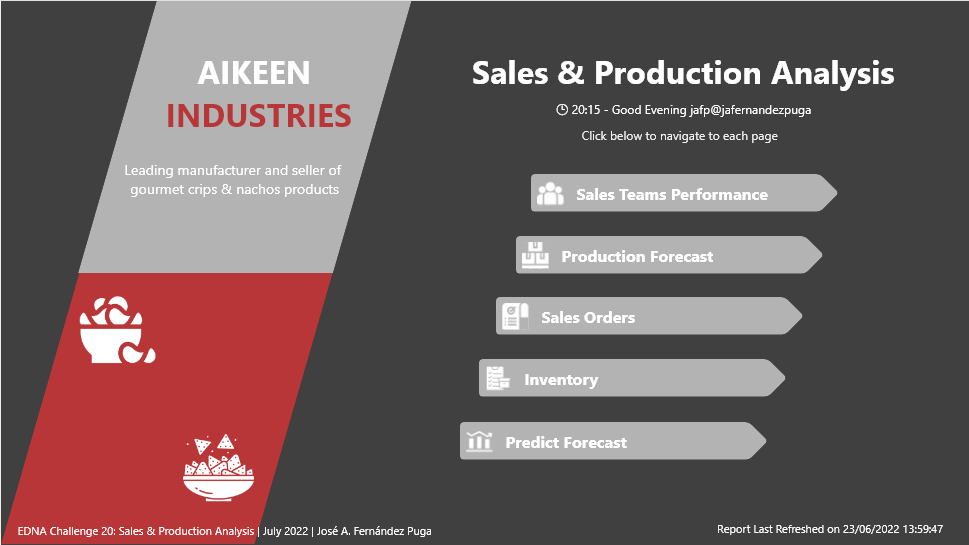
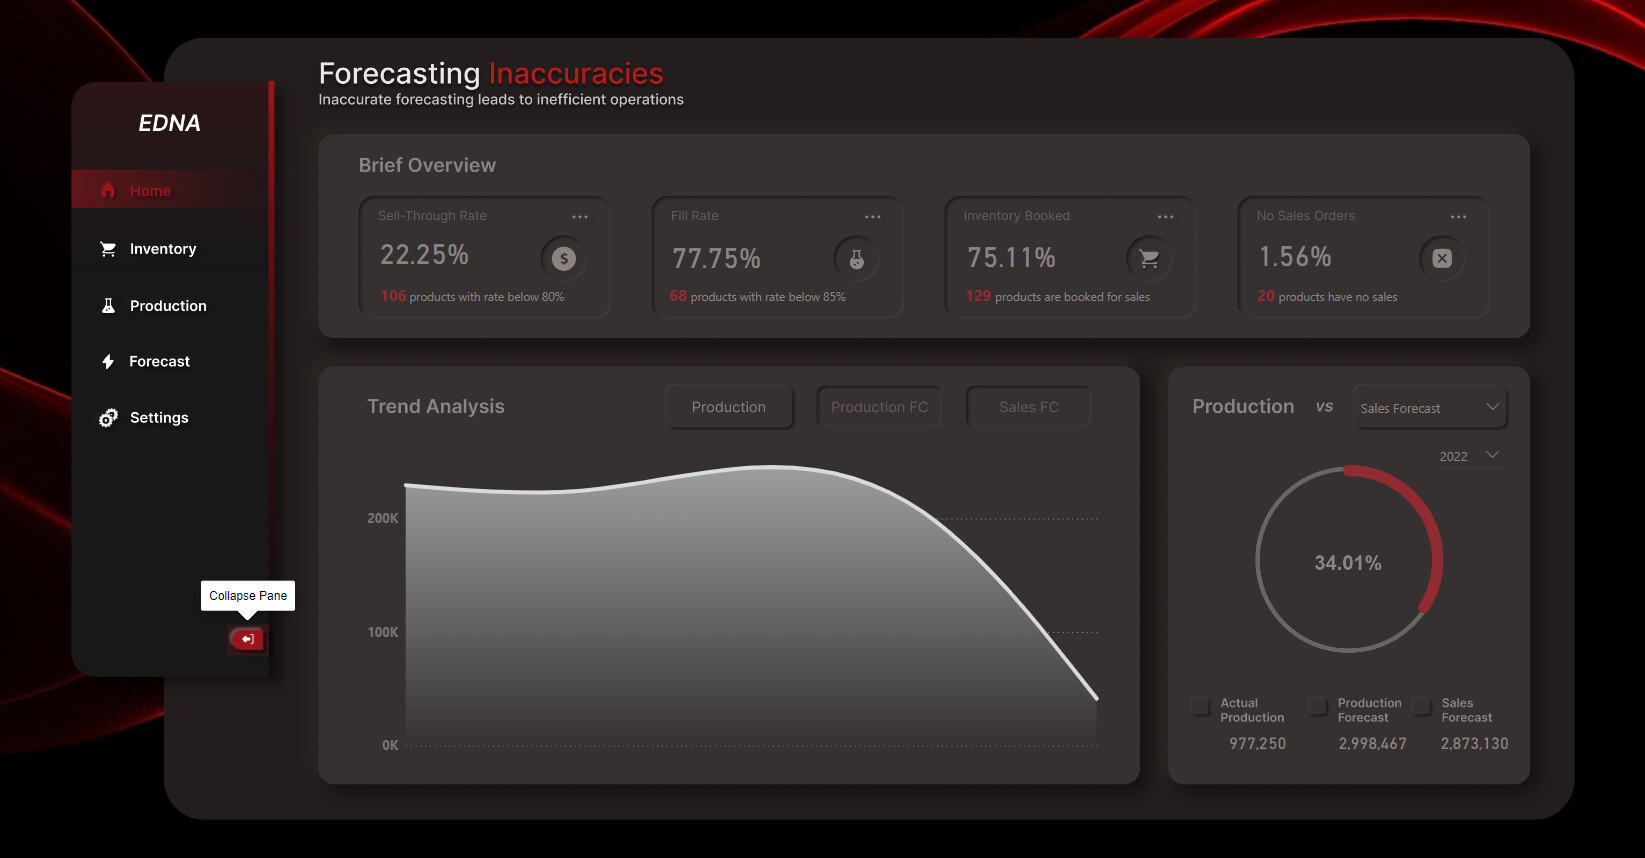
Home screen that contains the navigation buttons to each of the report pages.
A welcome message has been added to the report user by creating the following measure:
Welcome Text =
VAR _Hour = HOUR( NOW() )
VAR _Minute = MINUTE( NOW() )
VAR _Greeting = SWITCH(
    TRUE(),
    _Hour >= 0 &&
    _Hour < 6,
    "Good Night", _Hour >= 6 &&
    _Hour < 12,
    "Good Morning", _Hour >= 12 &&
    _Hour < 18,
    "Good Afternoon", _Hour >= 18 &&
    _Hour < 24,
    "Good Evening"
)
VAR _Time = TIME( _Hour, _Minute, 0 )
VAR _DomineandUserName = USERNAME()
VAR _Position1 = SEARCH(
    "\" , _DomineandUserName , 1 , 0 )
VAR _Position2 = SEARCH( "." , _DomineandUserName , 1 , 0 )
VAR _UserName = SWITCH( TRUE() ,
 _Position1 <> 0 , MID( _DomineandUserName , _Position1 + 1 , LEN( _DomineandUserName ) ) ,
 _Position2 <> 0 , LEFT( _DomineandUserName , _Position2 -1 ) , "" )

RETURN "🕒 "&FORMAT(_Time,"hh:nn")& " - "& _Greeting& " "&_UserName
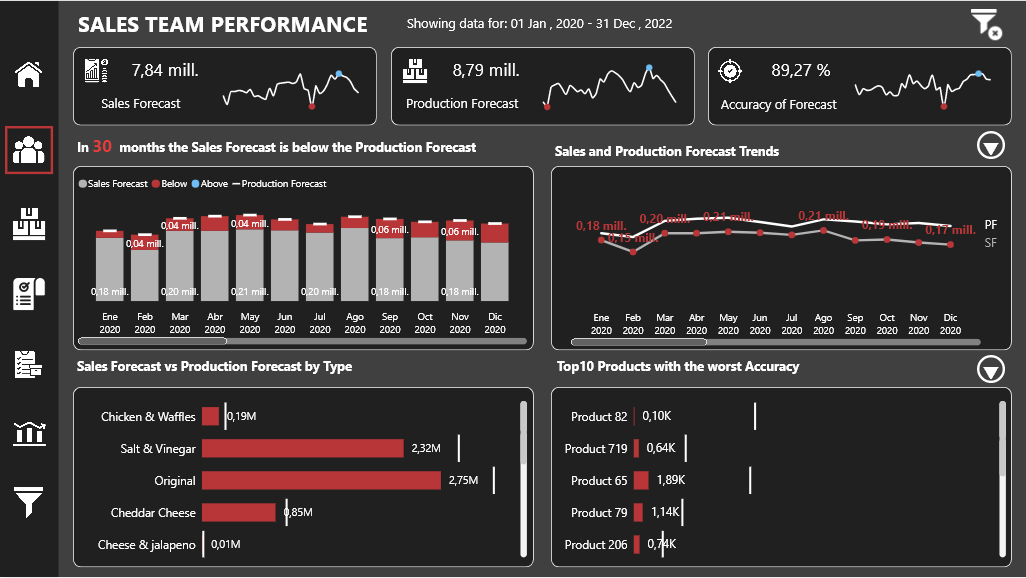
• Sales Team Performance
In this first screen we analyze the performance of the sales team by comparing the sales forecast with the production forecast.
In the first graph, by using a Line and stacked column chart, we can see the months in which the sales forecast has fallen below the production forecast.
The bars are made up of 3 measurements, the gray part is the minimum value between the sales forecast and the production forecast, the red part is what we have lacked from the sales forecast to reach the production forecast and the blue part, the amount of sales forecast that has exceeded the production forecast.
The line of the graph represents the objective measurement that is the production forecast, in which we are only showing the marks.
In the second graph, using a line graph, we can see the trend of both measures showing the months in which the sales forecast is less than the production forecast.
We have the possibility of defining a % confidence range on the production forecast by clicking on the button on the right. If a percentage is indicated, the area is represented by the Error Bars and only those points that are below the confidence area are shown.
In the third graph, a bullet chart by OKViz is used comparing the Sales Forecast and the Production Forecast by Product Type.
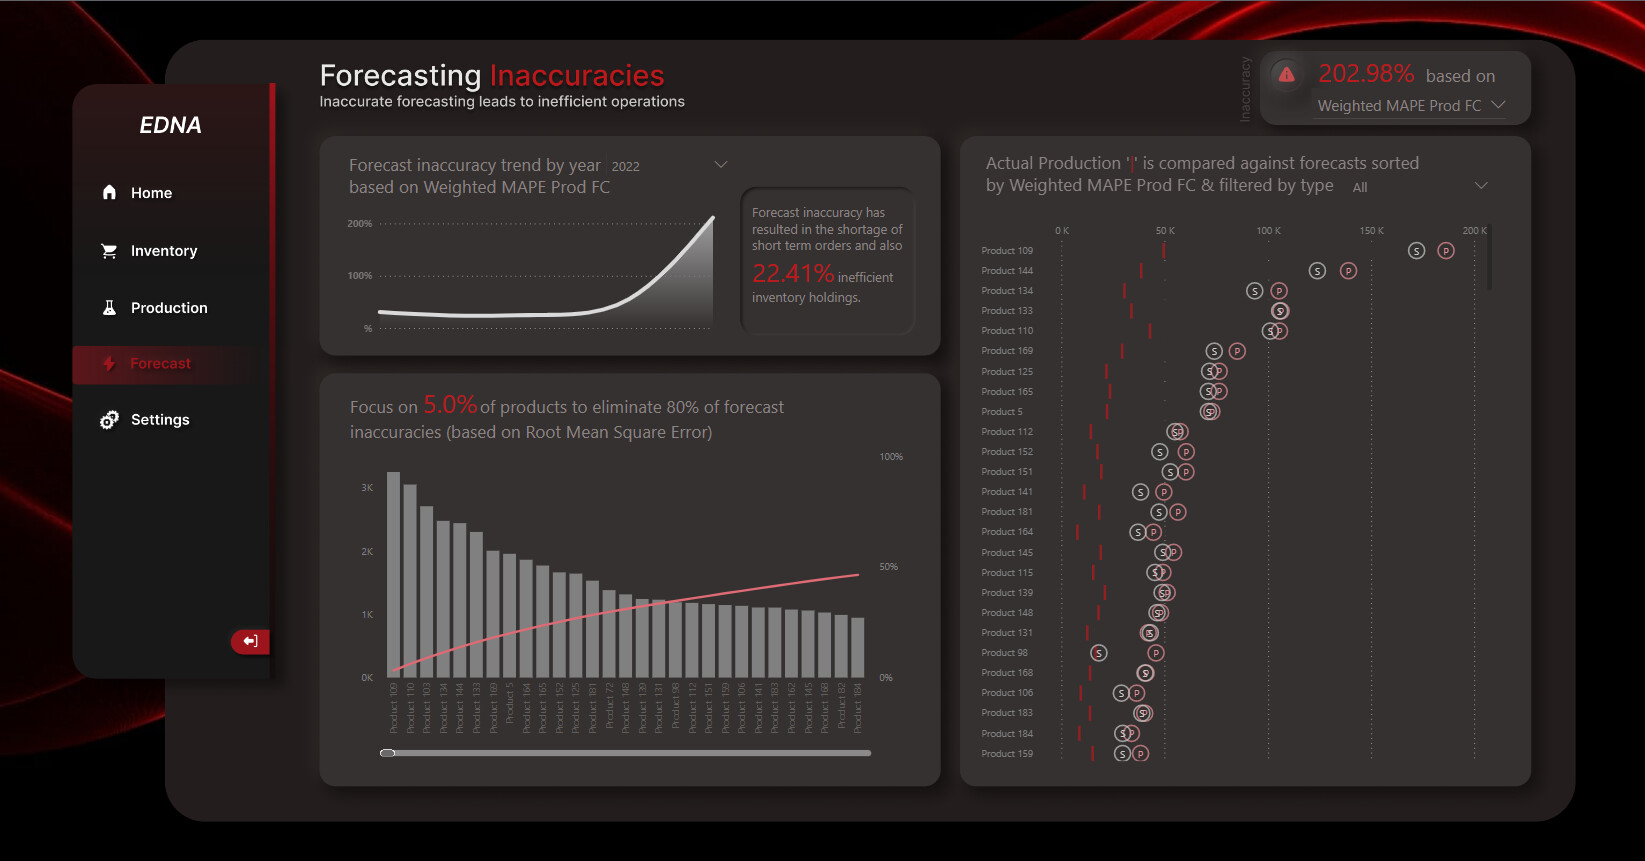
In the fourth graph, we show the Top X of the products with the worst accuracy of forecast, in which we can indicate the number of products that we want to show in the button on the right. (1-20)
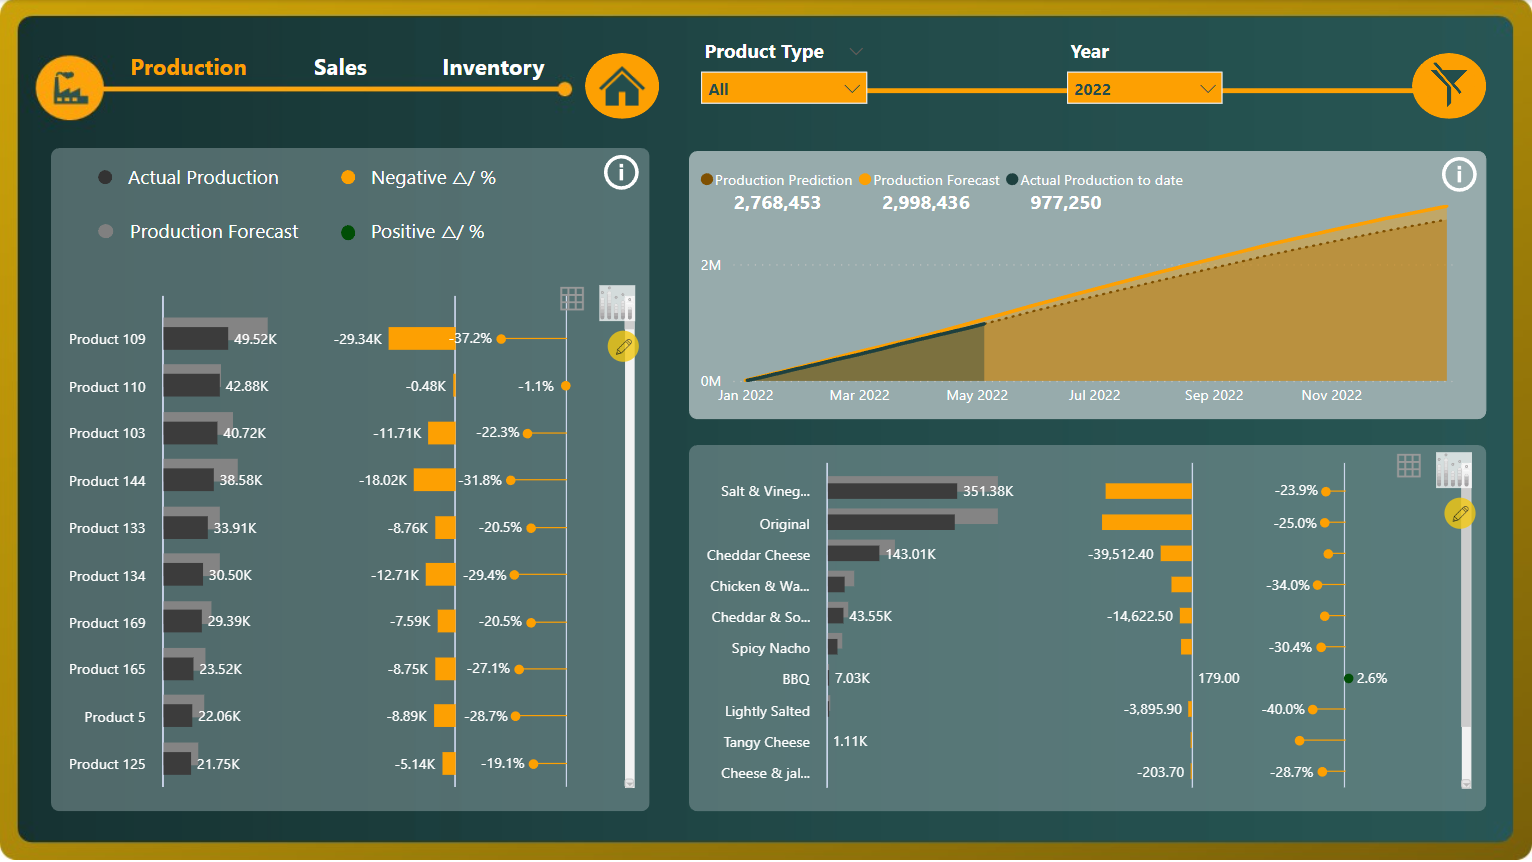
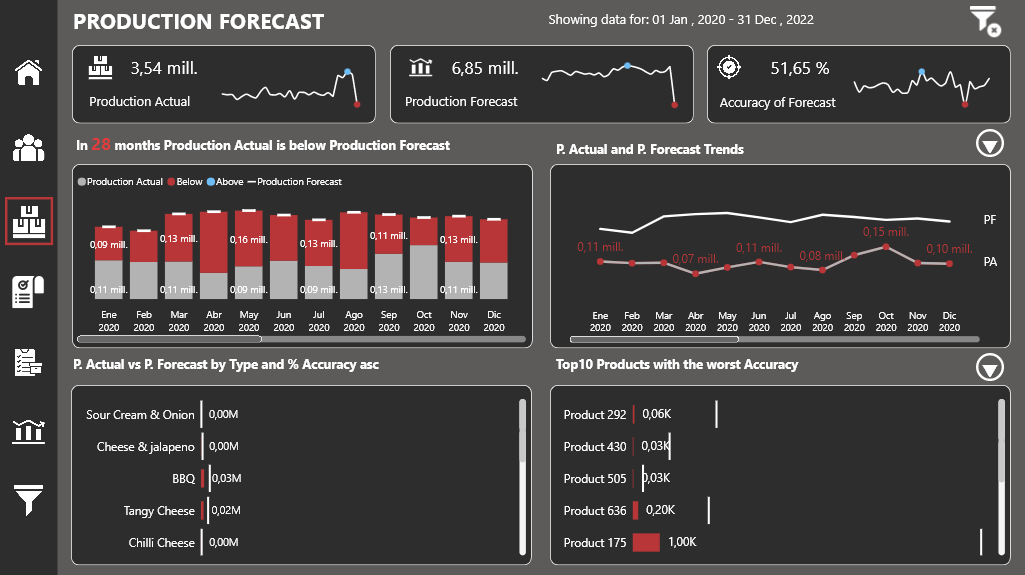
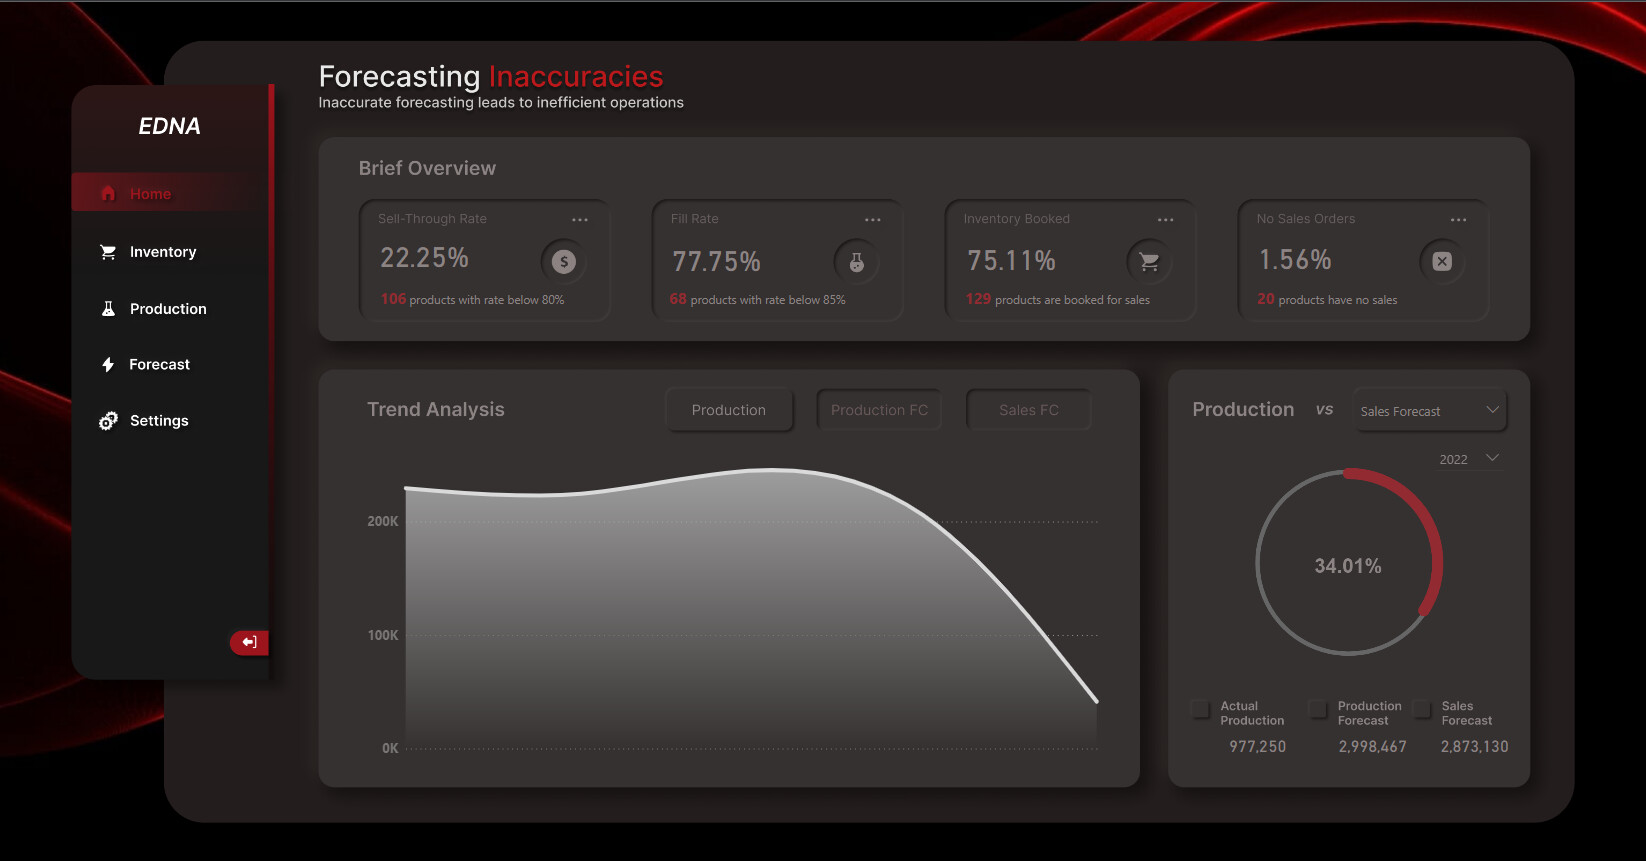
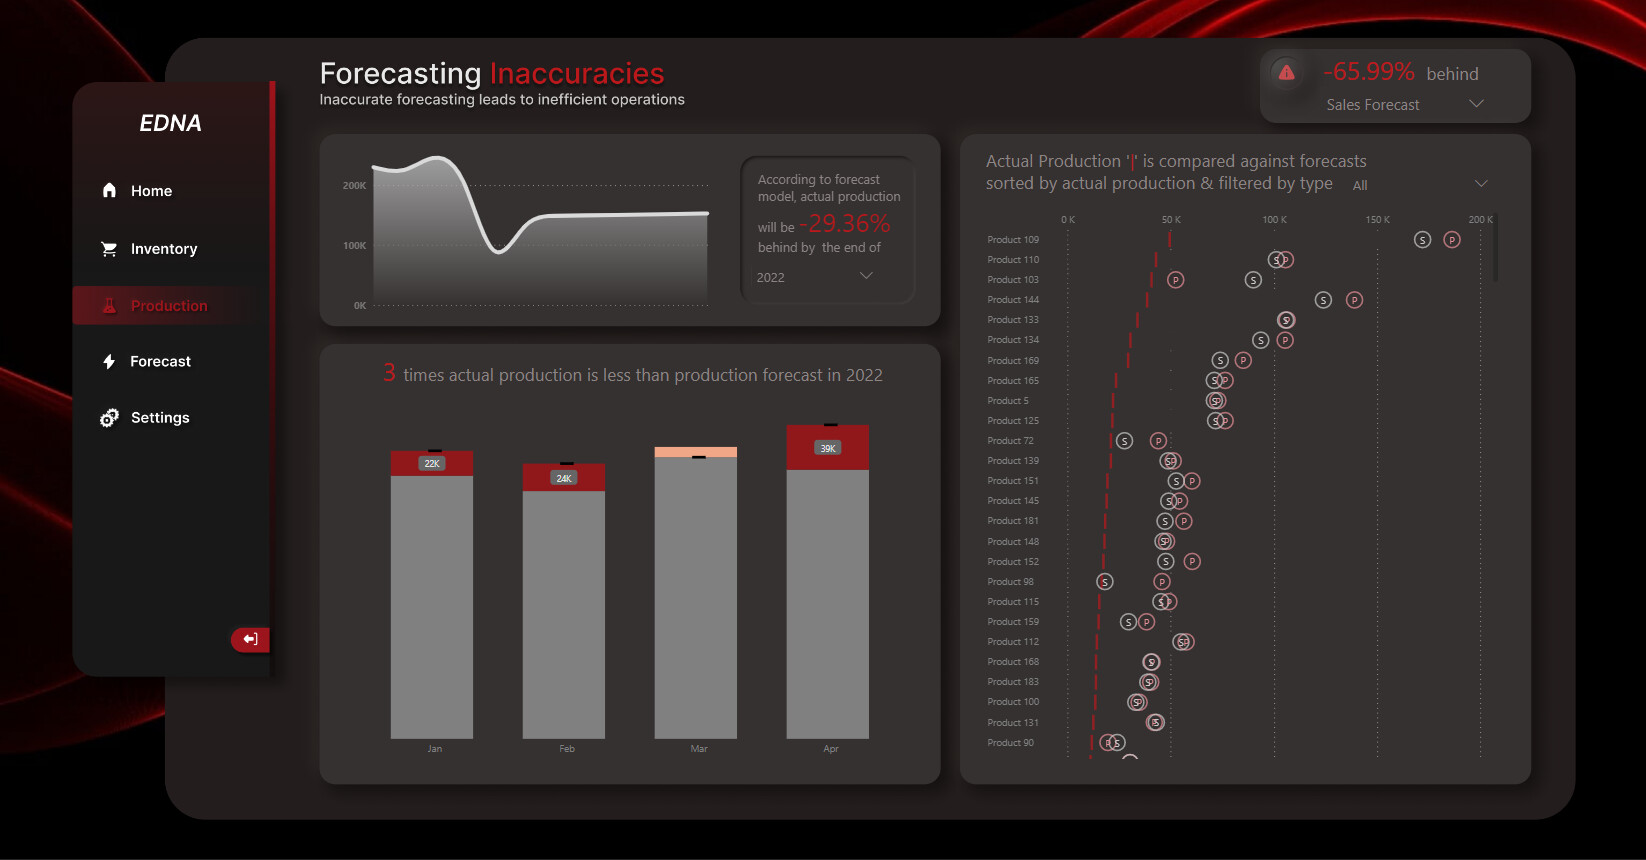
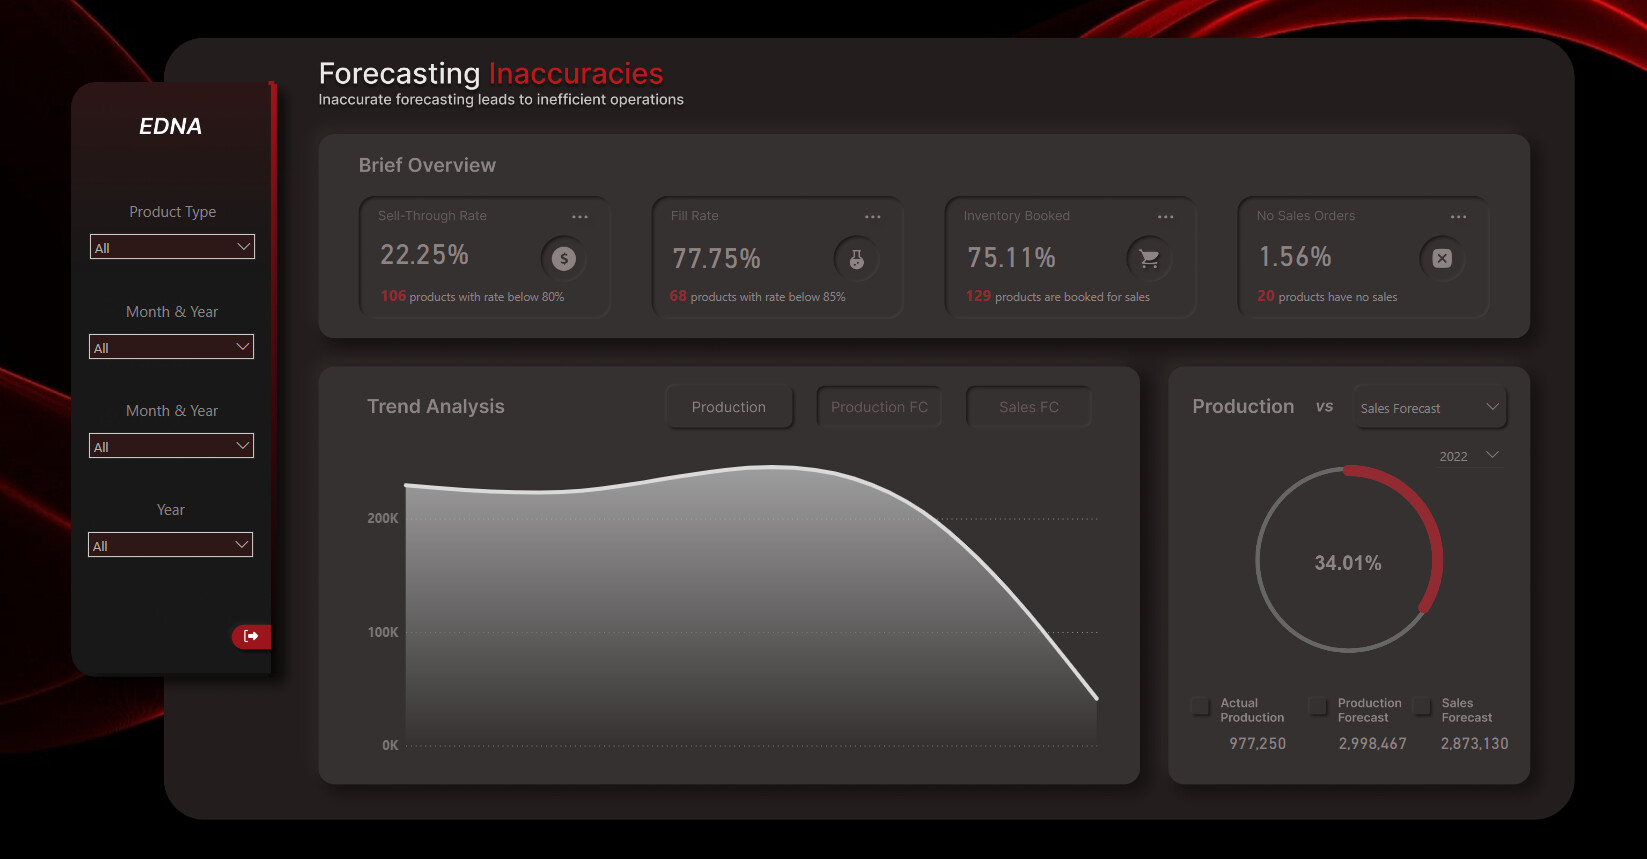
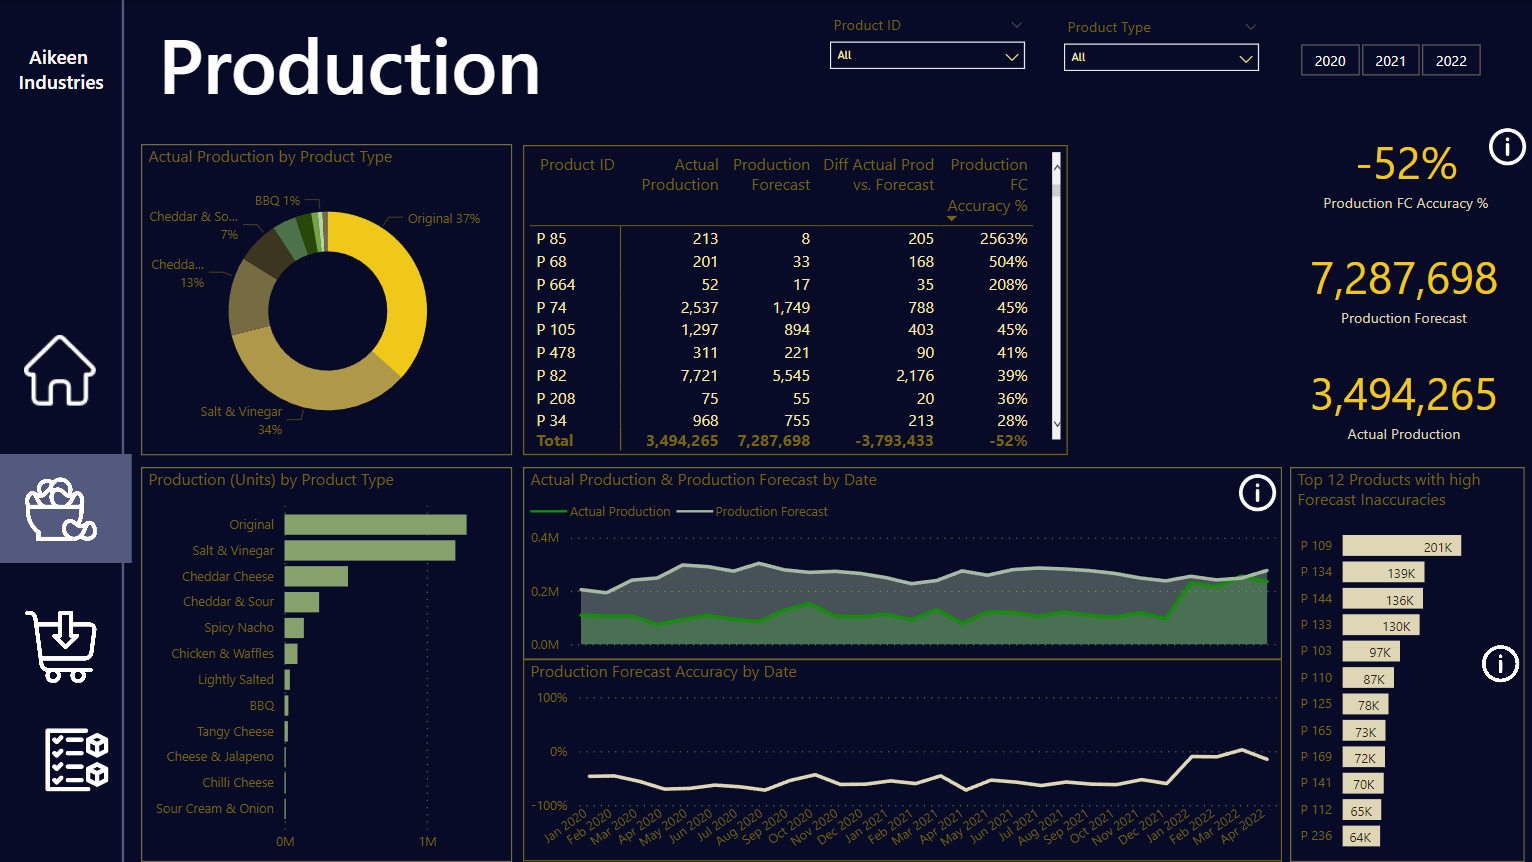
•Production Forecast
In this screen we use the same graphics as in the previous screen to answer the following questions:
Forecast inefficiencies when comparing actual production to forecast production.
Identify products with high forecast inaccuracies based on historical data.
Forecast Accuracy = (Actual Production / Production Forecast)* 100
Due to the fact that we have the real production information daily until 05/05/2022 and the production forecast is monthly, to compare both measures another measure has been created that distributes the production forecast daily.
Total Production Forecast Allocation =
VAR _LastProductionDate =
CALCULATE(
    MAX( Fact_Actual_Production[Date] ),
    ALL( Fact_Actual_Production )
)
VAR _DayInContext = CALCULATE(
    COUNTROWS( Dim_Dates ),
    KEEPFILTERS(
        Dim_Dates[Date] <= _LastProductionDate
    )
)
VAR _DayinMonth = CALCULATE(
    COUNTROWS( Dim_Dates ),
    ALL( Dim_Dates ),
    VALUES( Dim_Dates[Month & YEAR Sort] )
)
VAR _CurrentMonth = SELECTEDVALUE( Dim_Dates[Month & YEAR Sort] )
VAR _MonthlyProductionForecast = CALCULATE(
    [Total Production Forecast],
    TREATAS(
        VALUES( Dim_Dates[Month & YEAR Sort] ),
          'Fact_Production_Forecast'[Month & YEAR Sort]
    )
)
VAR _Result = IF(
    OR(
        HASONEVALUE( Dim_Dates[Date] ),
        HASONEVALUE( Dim_Dates[Month & YEAR Sort] )
    ),
    DIVIDE( _DayInContext, _DayinMonth, 0 ) * _MonthlyProductionForecast,
    BLANK()
)

RETURN
IF( ISBLANK( _Result ), 0, _Result )
We also show the information up to the month of May 2022.
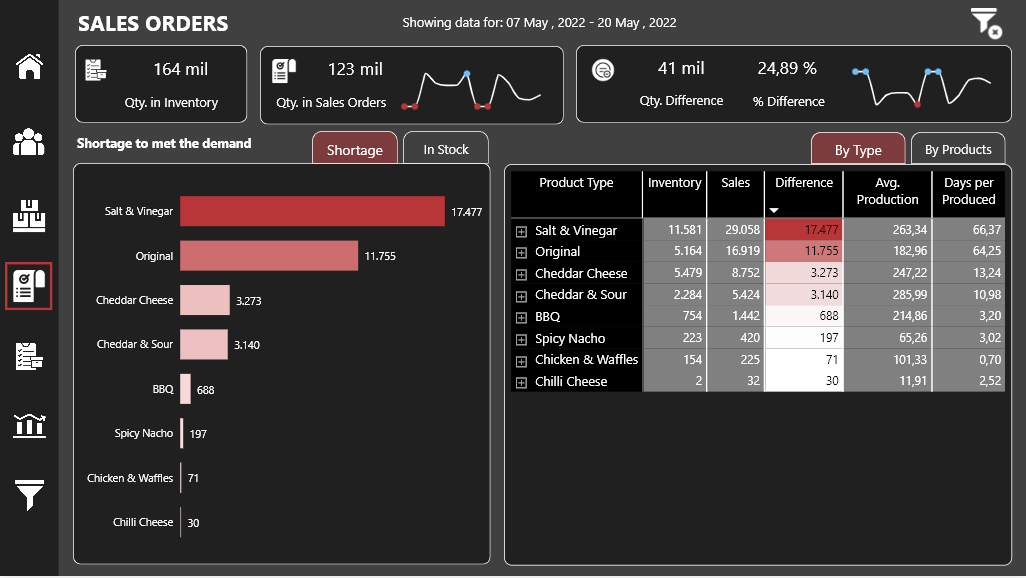
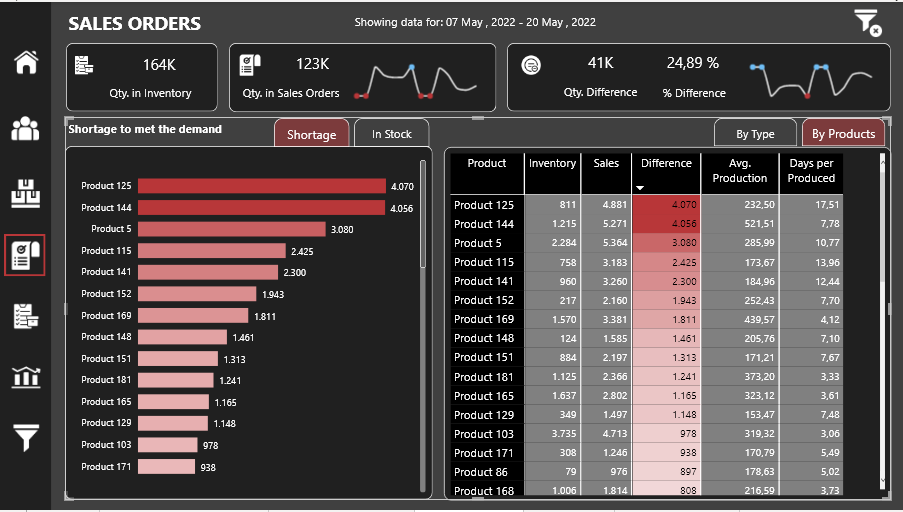
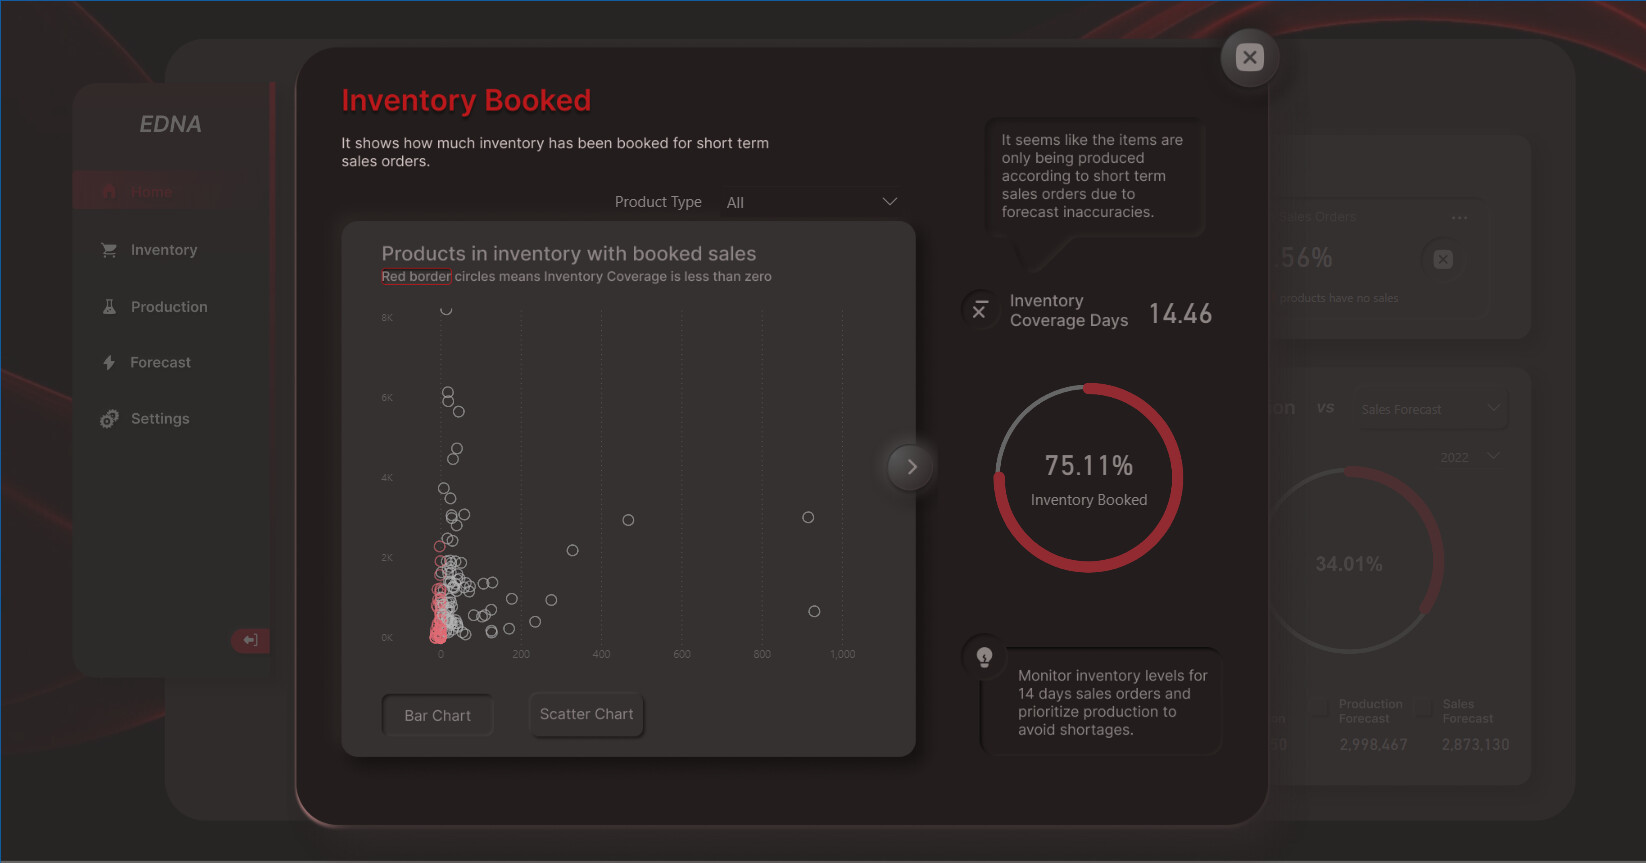
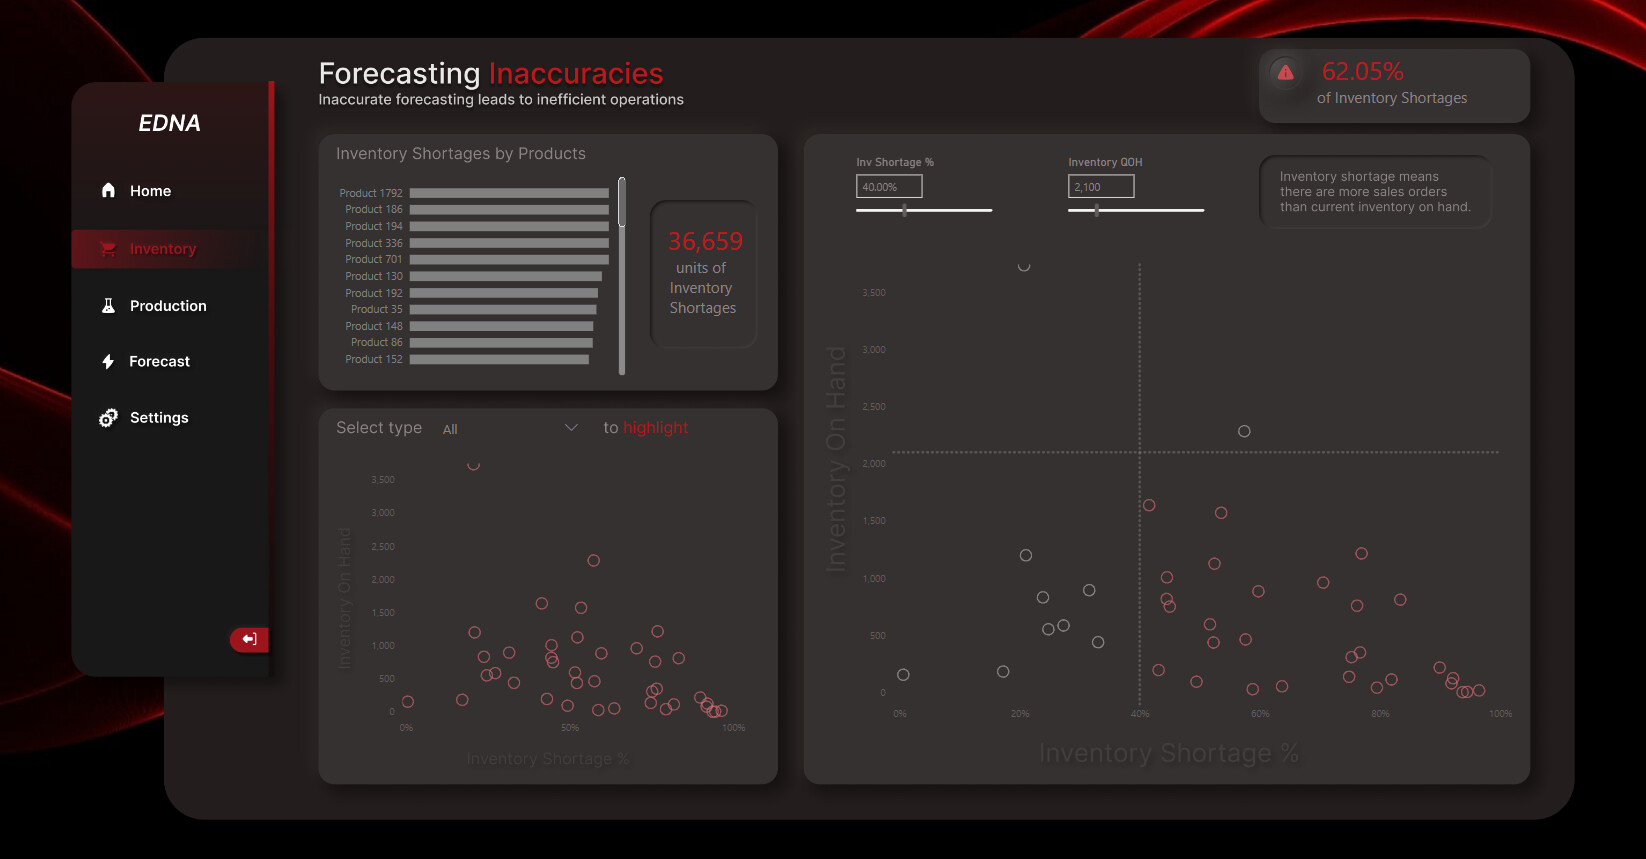
• Sales Orders
In this third screen, we analyze the information that we have in the Sales Orders table by comparing the number of products that we have in inventory and the number of products that we will sell in the next 14 days.
We can modify the date range in case we want to see fewer days than the 14 days for which we have information.
In the Bar graph and in the matrix we can see the information by Type or by Product of those for which we have a shortage or for which we have sufficient quantity to meet future sales.
The Drill and expand the levels options have been disabled and Bookmark has been used to display the Type or Product information.
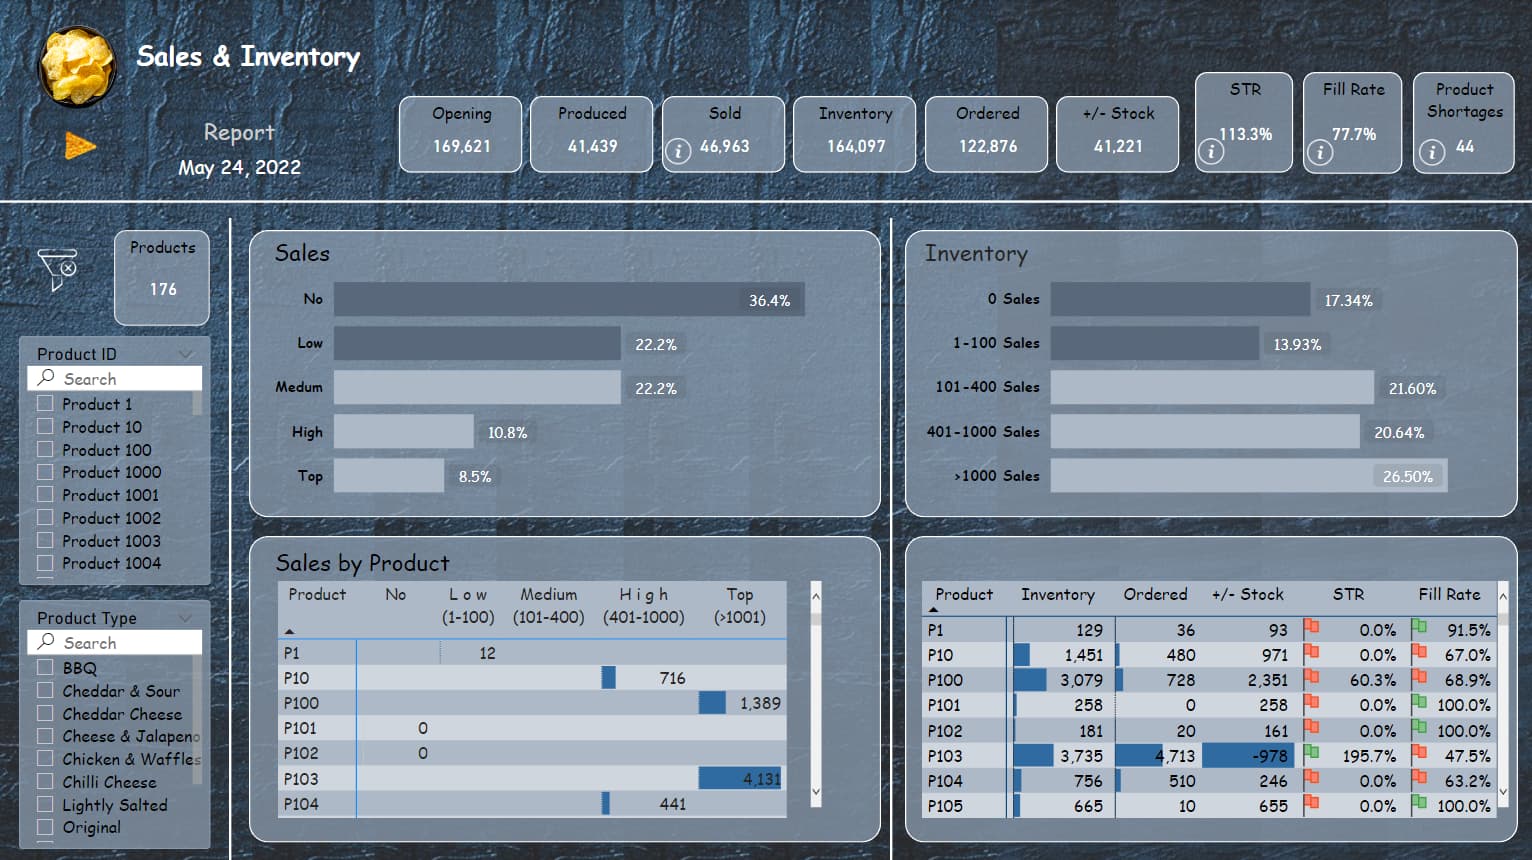
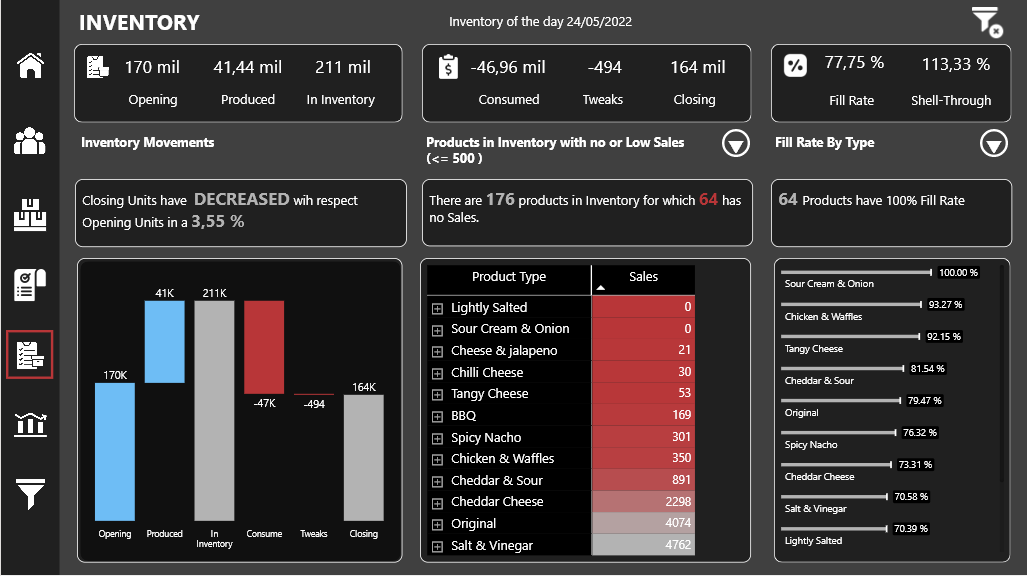
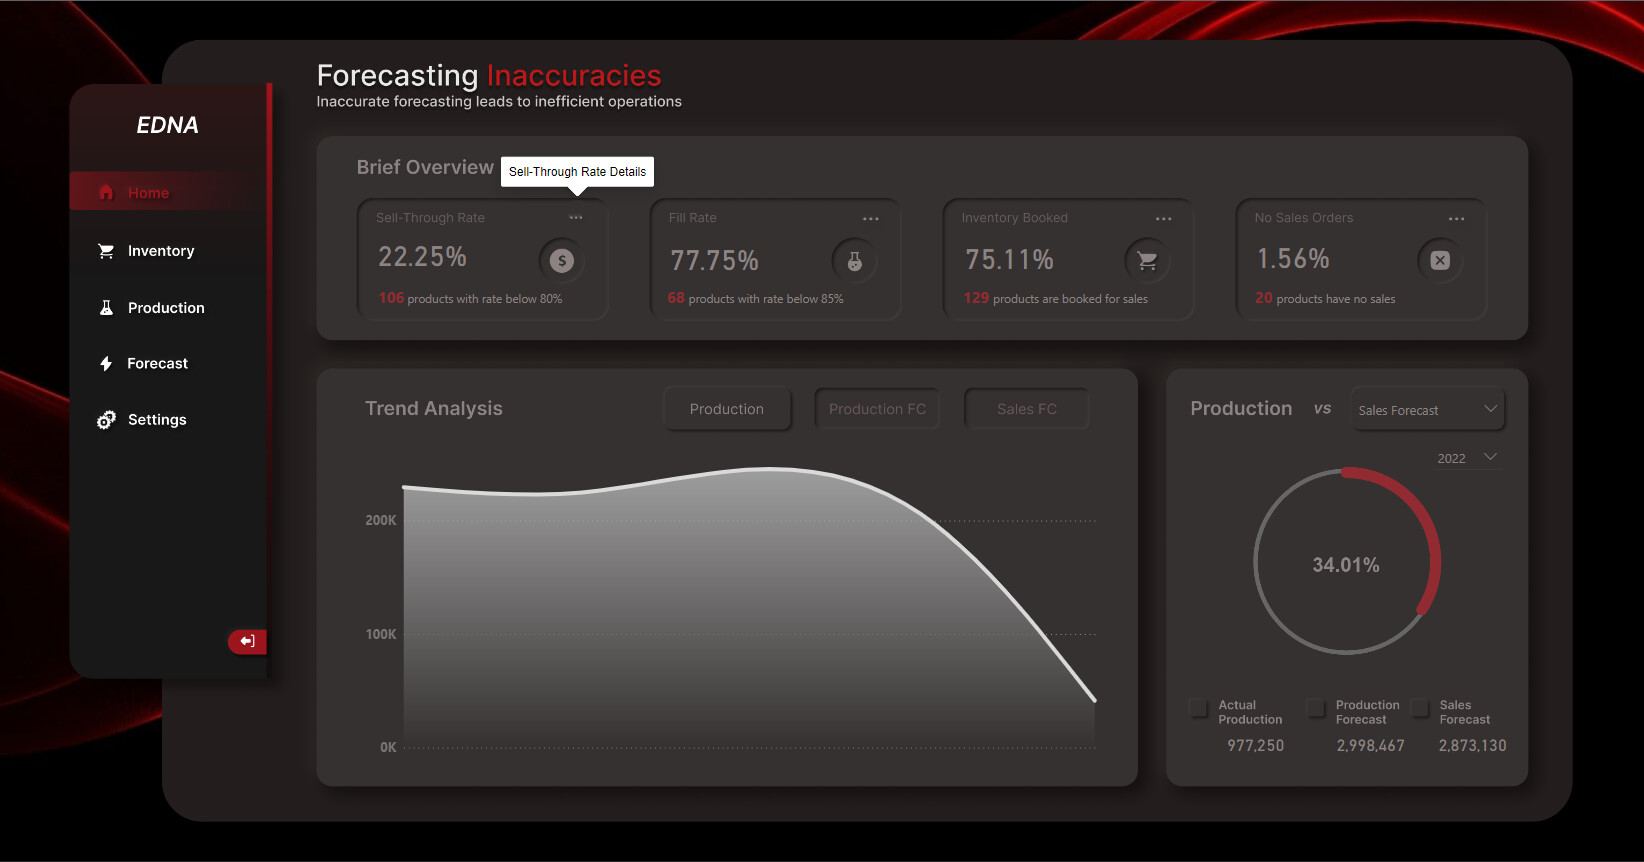
•Inventory
In the Inventory screen we show the information of the different movements of the inventory items along with the fill rate and the direct sale rate.
Through the waterfall graph we can see how our inventory increases and decreases based on the different movements, also taking into account the adjustments made to the inventory.
We also show the percentage of increase or decrease of the closing units with respect to the opening units.
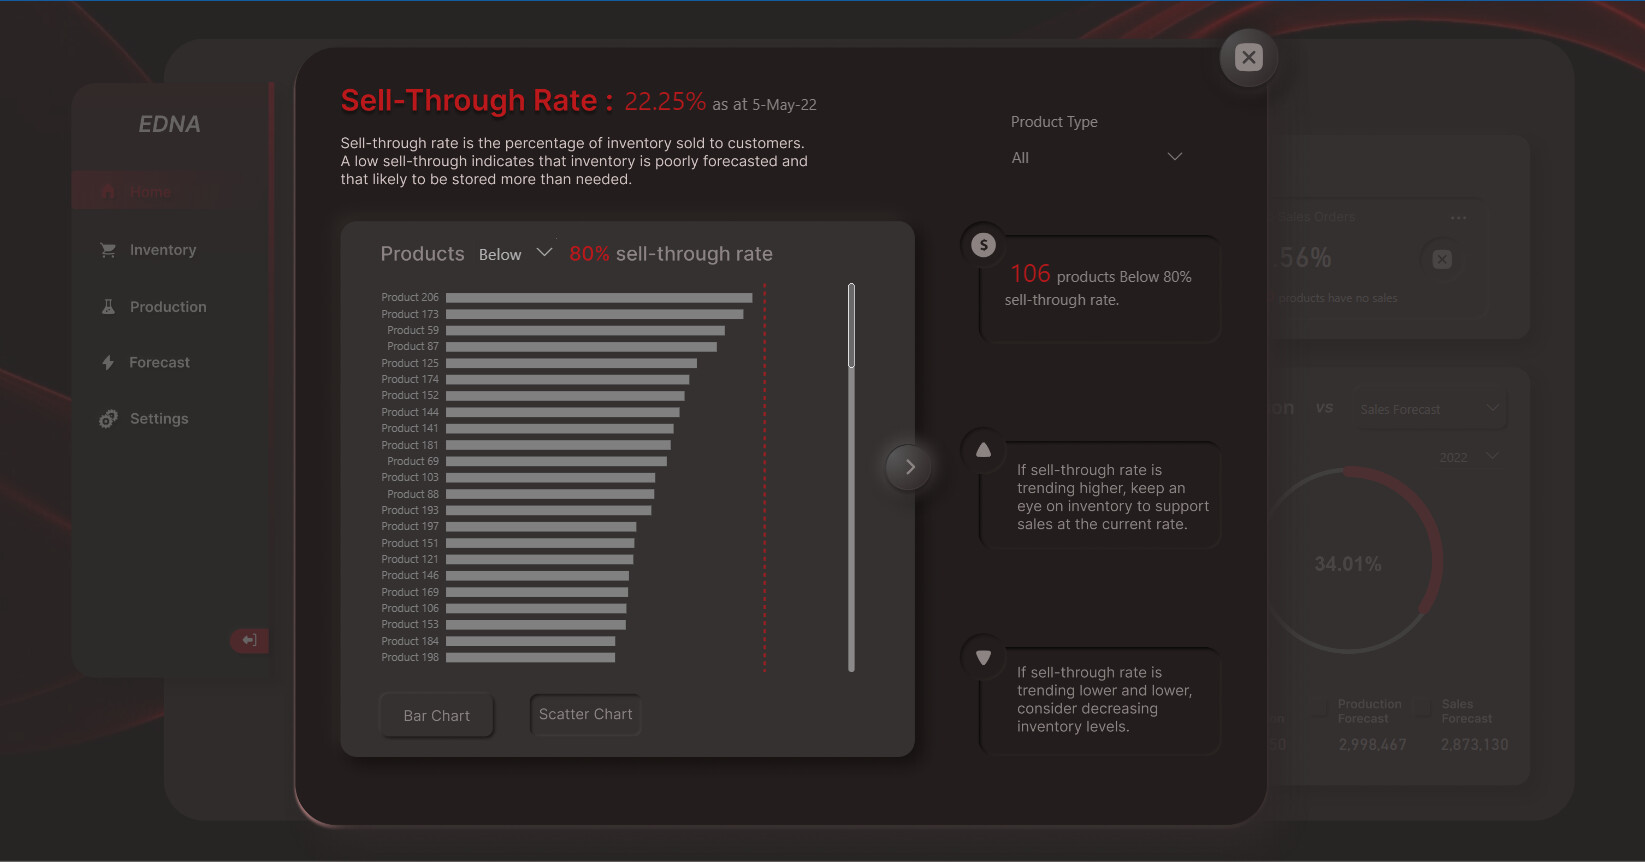
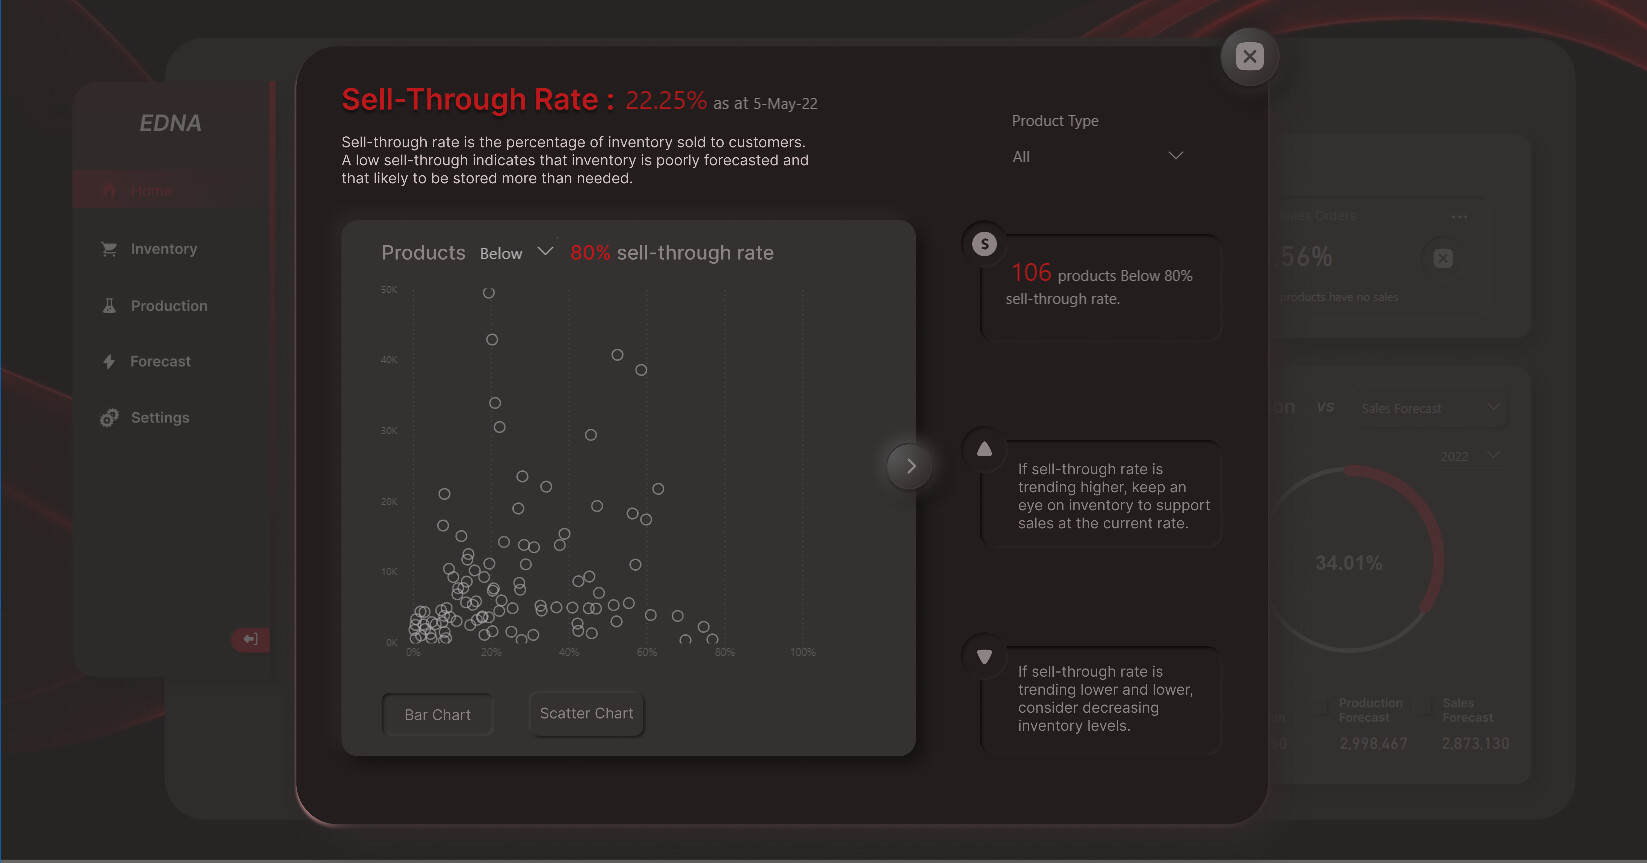
In the matrix we identify the items for which we have no sales or low sales.
We can indicate if we want to take into account as sales only the units consumed in the inventory, the units collected in future sales orders or both, together with the limit of the quantity to consider as low sales.
In the horizontal bar graph we can consult the fill rate or the direct sales rate by Type or by Product.
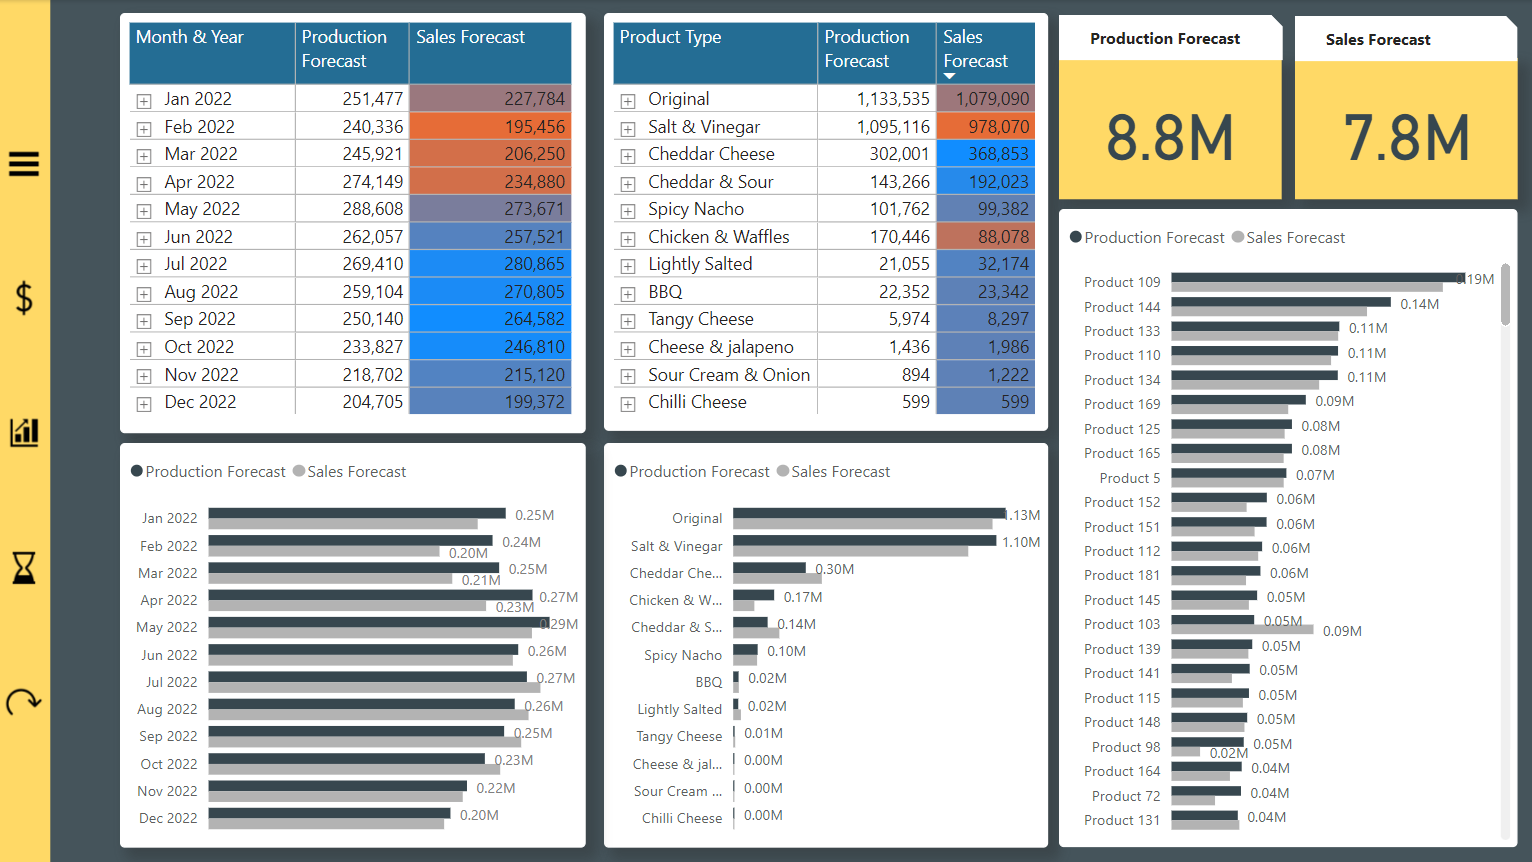
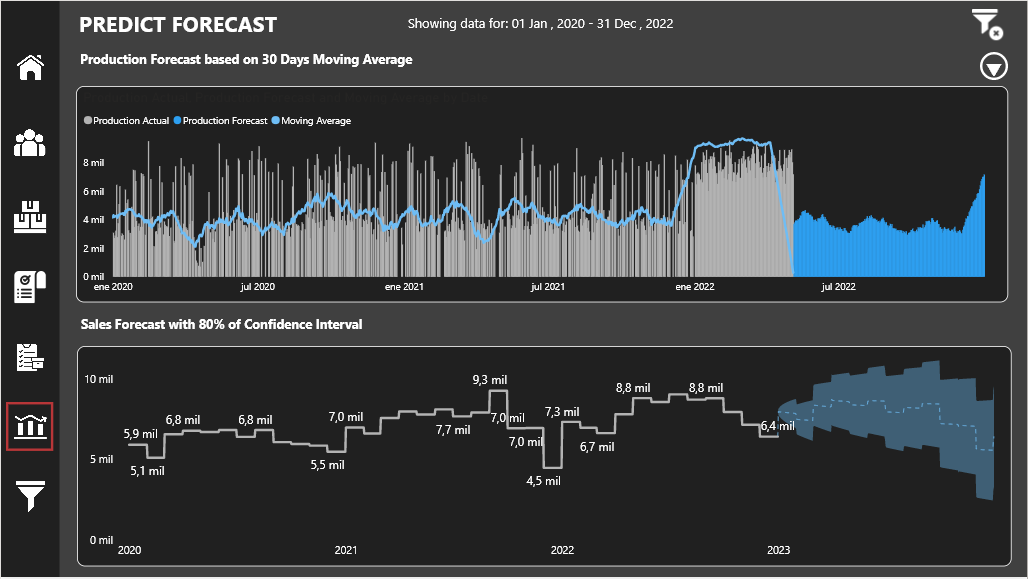
• Forecast Forecast
On the Forecast Prediction screen, first of all, we calculate the Production Forecast for the remainder of the year 2022 by using the Moving Average, being able to indicate the number of Intervals and the interval (Day, Month, Quarter and Year).
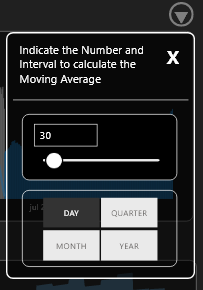
Finally, the calculation of the Sales forecast for the year 2023 is shown using the automatic Power BI forecast with 80% Confidence Interval.
Regards,
Hey Platform Members,
We are proud to announce the winners of the Enterprise DNA Challenge 20 “Sales & Production Reporting”
This month’s Winners are:
Overall and Platform Member Winner
![]() Jose Antonio Fernandez Puga
Jose Antonio Fernandez Puga ![]()
![]() Challenge Winner badge
Challenge Winner badge
Newcomer Winner
![]() Jocelyn Rivera
Jocelyn Rivera ![]()
![]() TBA with winner
TBA with winner
Non-Member Winner
![]() Camilo Corrales:1st_place_medal:
Camilo Corrales:1st_place_medal:
![]() Winner of a free subscription to Enterprise DNA learning Platform
Winner of a free subscription to Enterprise DNA learning Platform
Out of the Box Thinker Winner
![]() Jonathan van de Waard:1st_place_medal:
Jonathan van de Waard:1st_place_medal:
![]() TBA with winner
TBA with winner
Creative Head Winner
![]() Jenelyn Rosales
Jenelyn Rosales ![]()
![]() Winner of a free subscription to Enterprise DNA learning Platform
Winner of a free subscription to Enterprise DNA learning Platform
We would also like to congratulate our finalists and all participants.
It has been amazing to see the Enterprise DNA data platform family and Challenges Group members come together and learn on this month’s challenge and create stunning and creative reports!
Thank you to our judges panel Tim Weinzapfel, Paul Gerber, and Brian Julius for providing their expertise and time. Thank you to the Enterprise DNA Expert group for their inputs and feedback to the participants in the Enterprise DNA forum.
Finally, a big thank you to the Enterprise DNA Challenges Group “Community Lead Team” for their help and support during challenge 20, Solar Zhu and Kiruba Selvi.
![]()
![]() The Challenges Team is working hard to bring you Challenge 21. Challenge 21 will be launched on 11th July 2021.
The Challenges Team is working hard to bring you Challenge 21. Challenge 21 will be launched on 11th July 2021.
Thank you all!
Federico Pastor
Just the Winners_Challenge 20.pdf (1.1 MB)
Link to Judges video.

Great job everyone!
Fantastic entry and great write up! Really super work
Well done to all participant and winners. An inspiring round of the challenges. Quality was probably the best we’ve seen overall. Congrats to all
Sam
Impressive! Congratz @jafernandezpuga , well deserved!!
Hello Everyone!
JMAP is back in town ![]()
Here is our submission for Challenge 20.5 ![]()
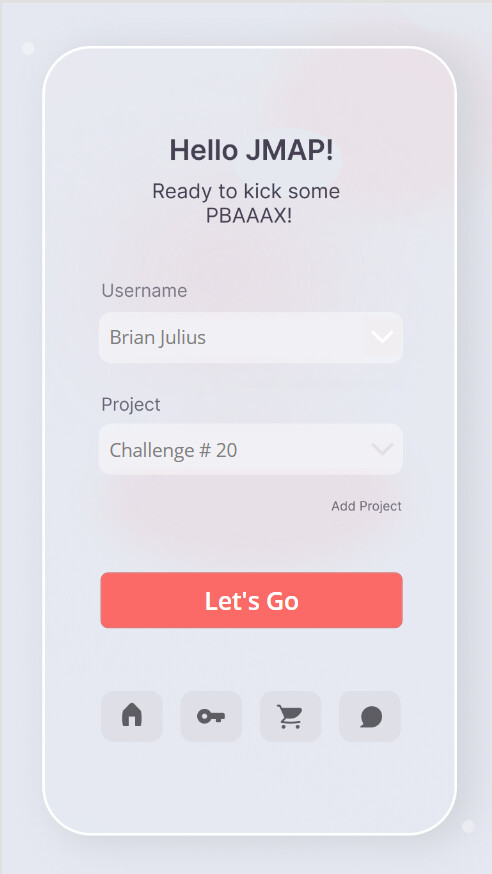
Welcome to Neumorphism World!
Here is the link to report:
For this challenge, we decided to use some corporate theme and incorporate in our report so we used Coca Cola theme for this challenge. We took some inspiration for the design and apart from the navigation pane and colors, everything that has been done is our own creativity and we reserve the rights for this ![]() .
.
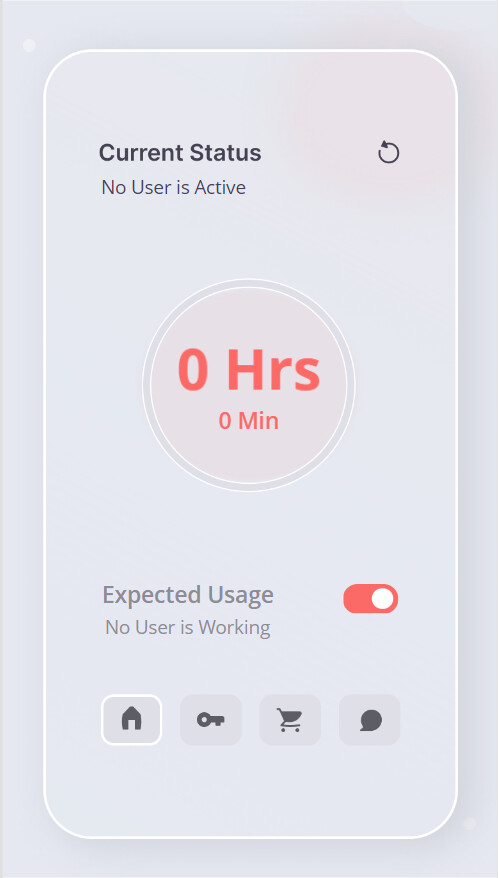
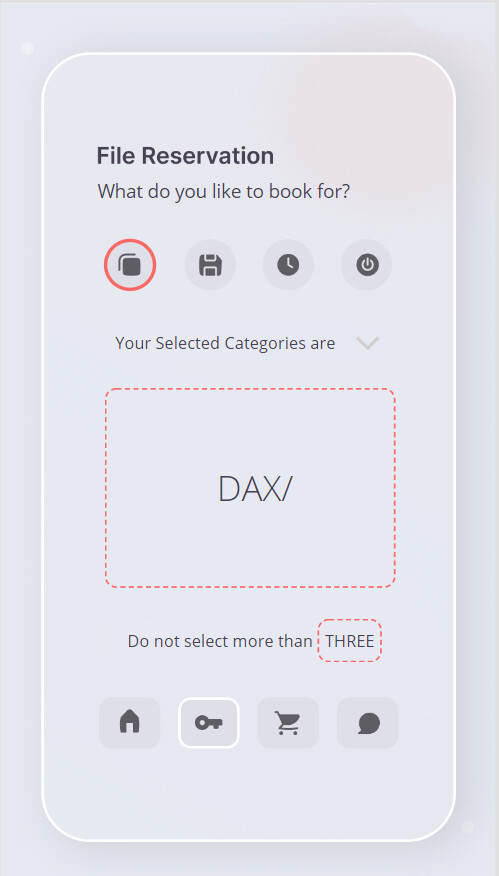
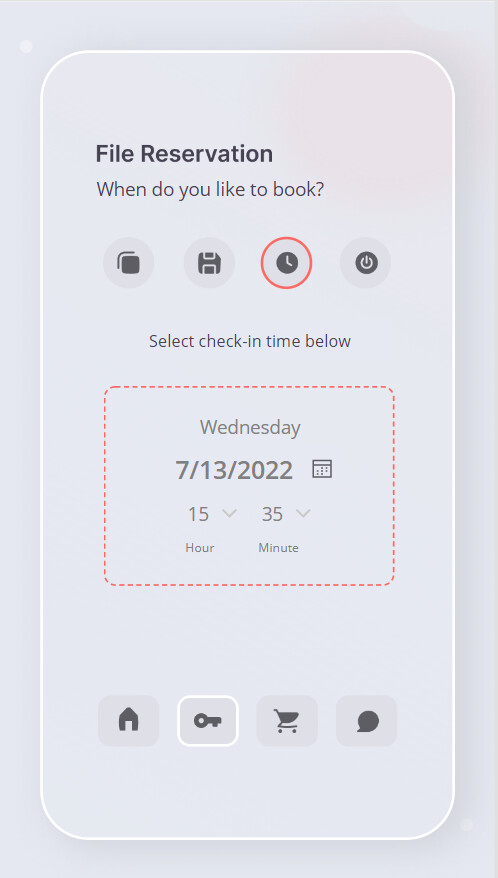
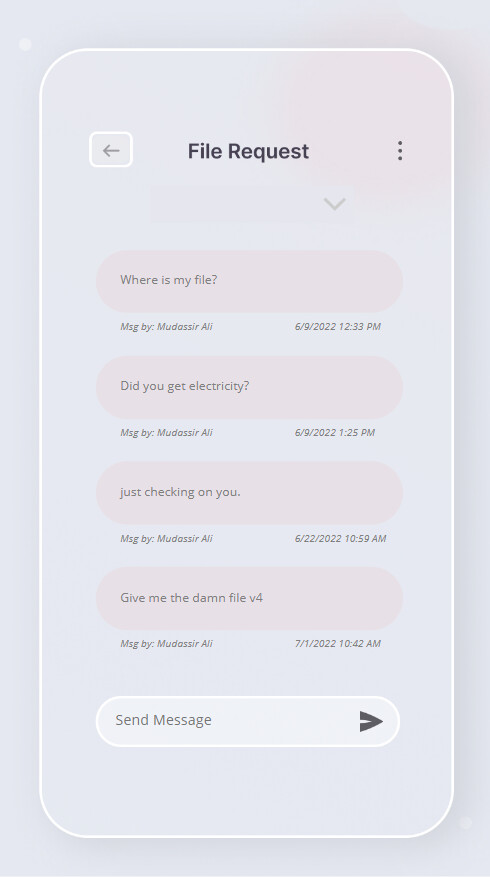
To collaborate on future challenges, we have also created Power Apps application (Glassmorphism Style) to make the collaboration as smooth as possible. Once again we used Coca Cola theme for the App design.
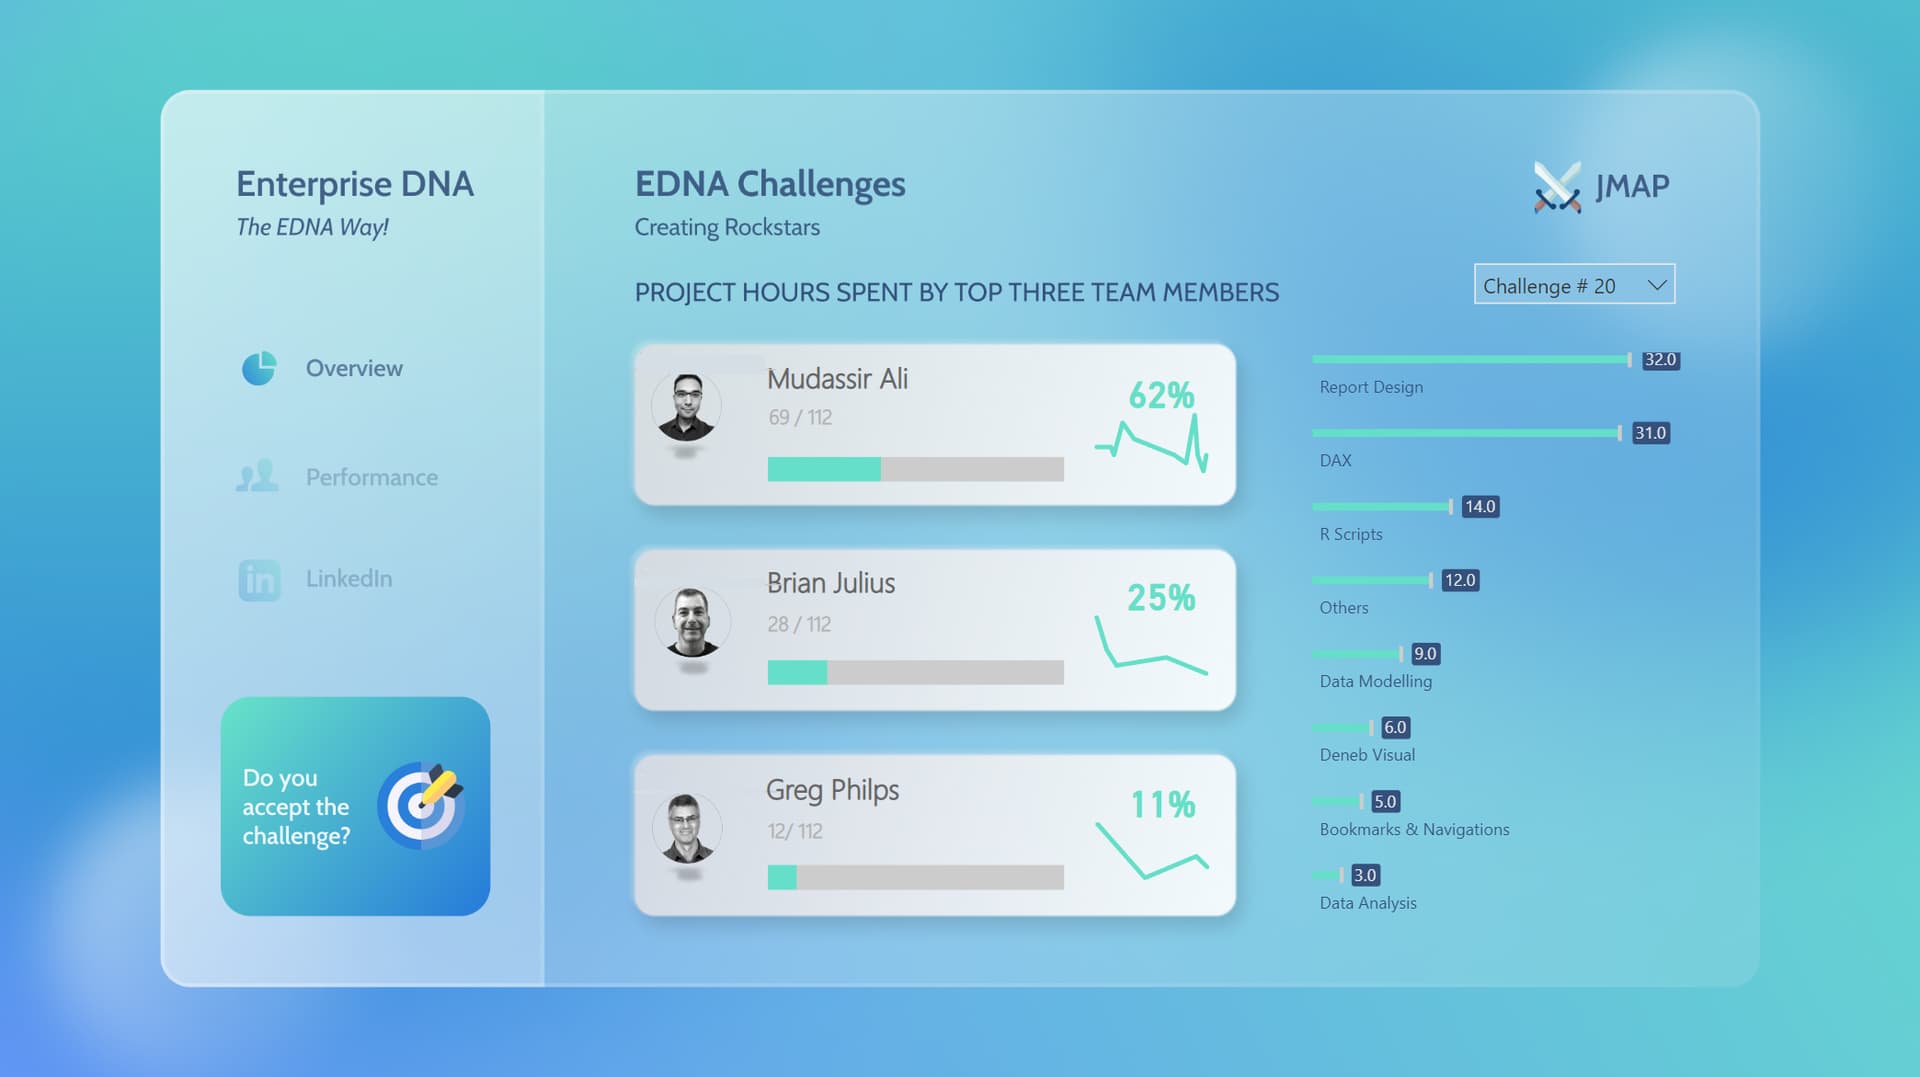
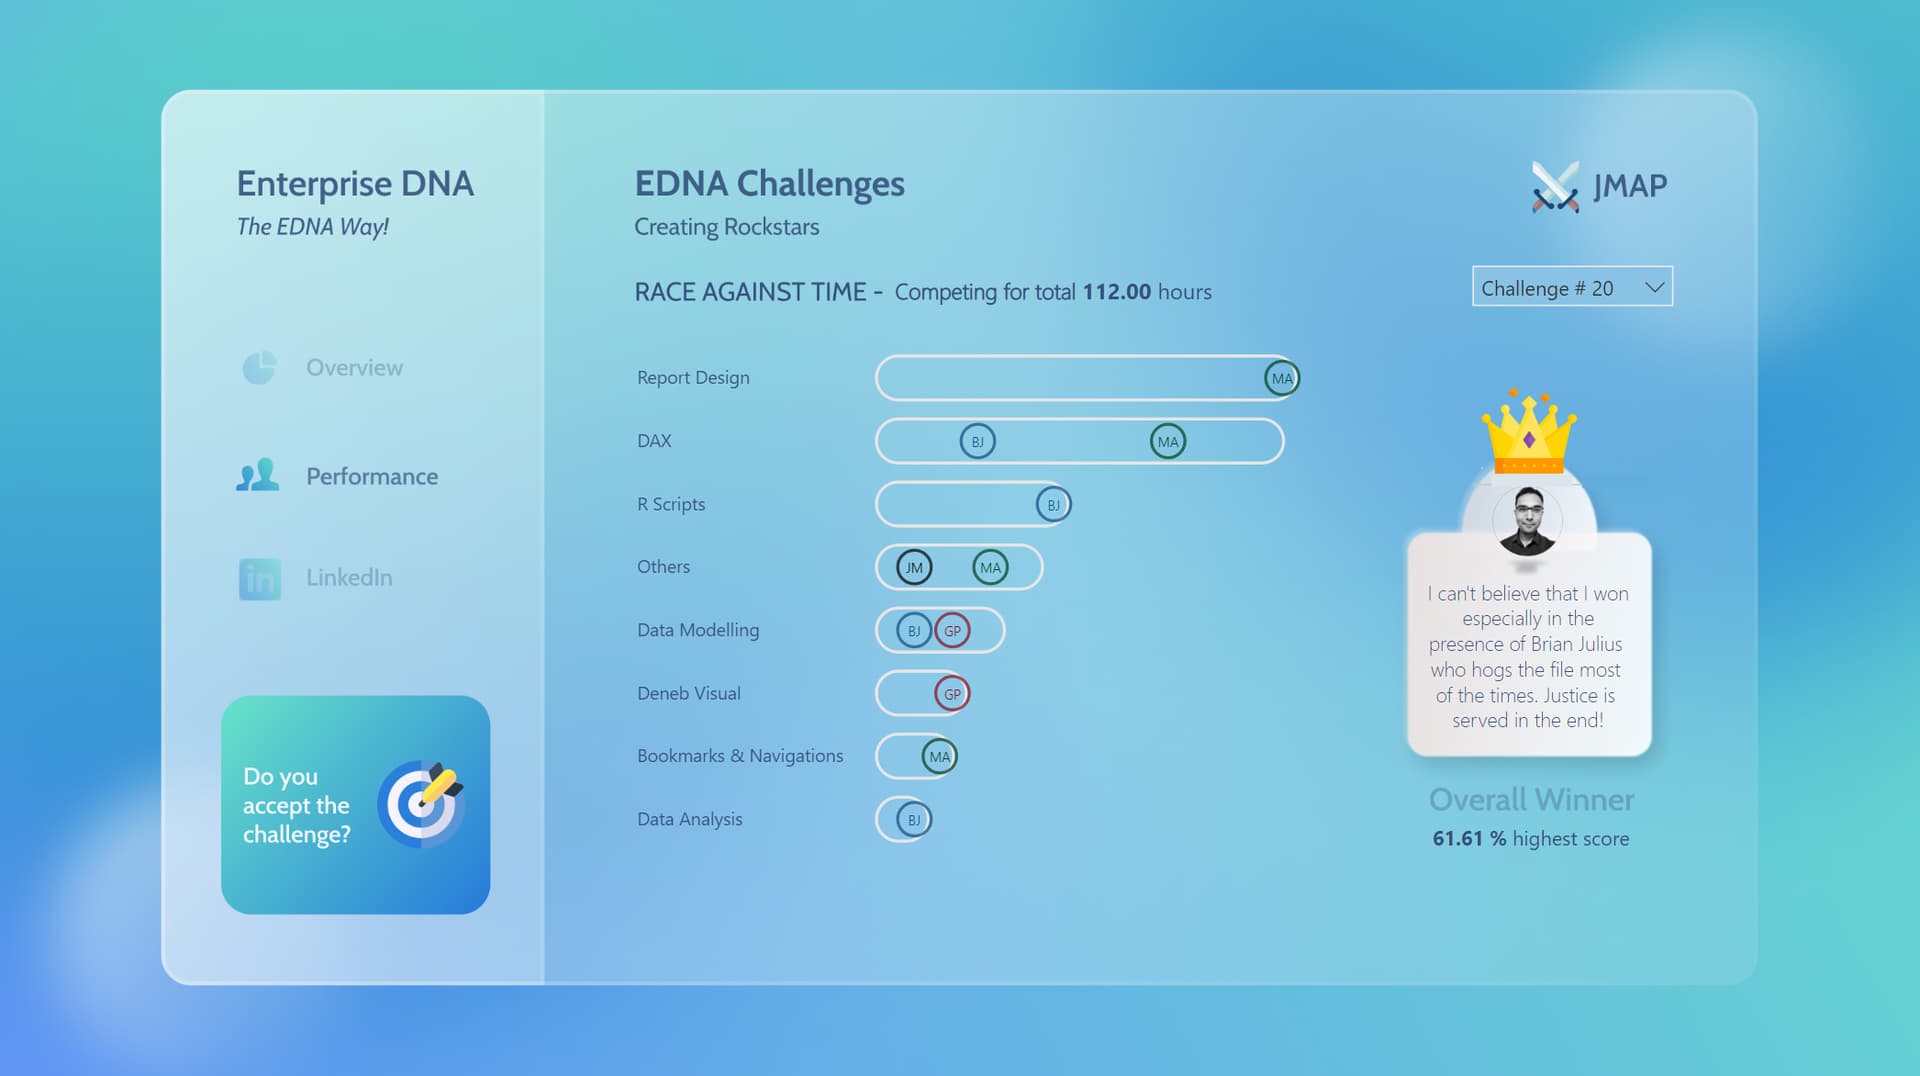
We also created another dashboard to measure our collaboration performance and results. There are some fine tuning to do that will be completed very soon.
Did you say Glassmorphism & Gaming?
As always, the collaboration experience was amazing and I learned something about Deneb from @Greg and forecasting models from @BrianJ. That’s the beauty of working together and sharing the skills. Honestly speaking, now I can’t see myself creating a report on my own as I am spoiled by working with @JarrettM, @Greg, and @BrianJ .
I would really advise the participants to try to work on a challenge within a team environment and I am certain that you will love that experience.
Moreover, special thanks to @alexbadiu for creating an area chart with curved smoothing lines that really blends in well with the overall design of the report.
P.S. These types of reports can only be created by eDNA members period! You can learn many things from somewhere else but you cannot learn to create reports like @FPastor, @alexbadiu, @Gustaw, @Greg, @BrianJ, @Alvi, @Melissa, @tweinzapfel, @JarrettM, specially ( @AntrikshSharma) and there are many others.
If you want to know how we built this then join our innovation lab where we will be discussing about this in detail.
Surprise : Stay tuned because another report is coming in shortly.
This is it for now and we will see you in C21.
Thanks,
JMAP Team.
Incredible stuff team. Best report I’ve ever seen, no doubt
Yep, this will be something to work around, dig in and learn the UI techniques used, I love it.
Excellent work JMAP Team.
Federico