I am looking to build one of the below view which is required, your help will be really appreciated.
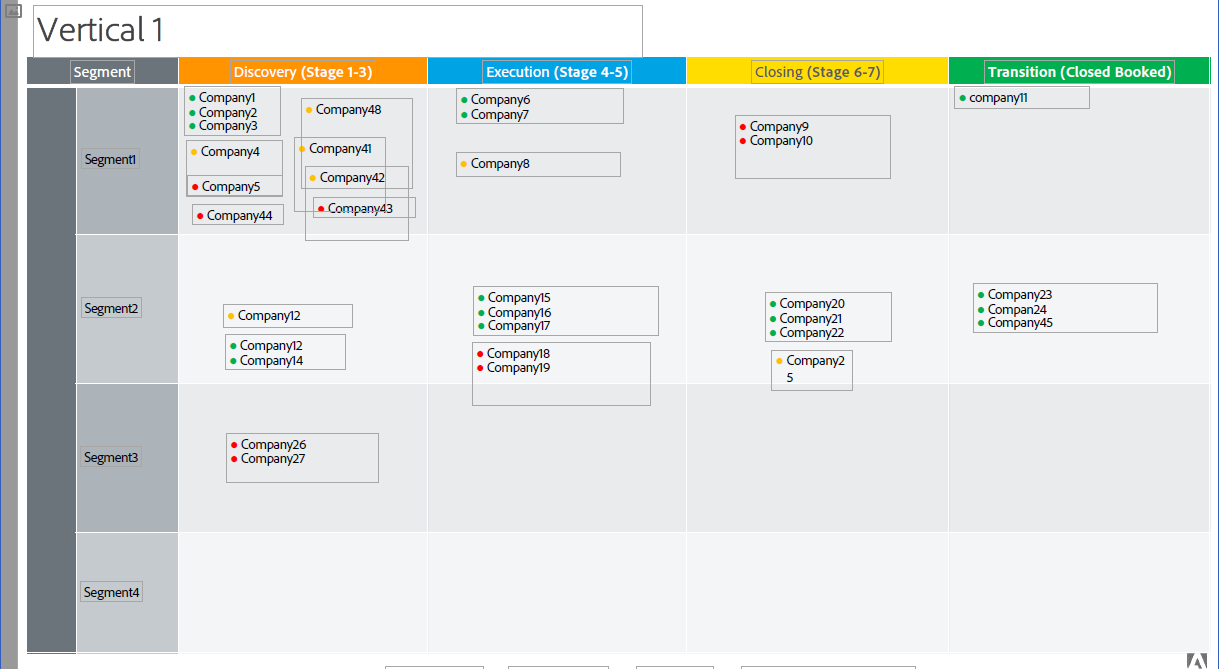
Below is the screenshot of the view required :
Demo Data: demodata.csv.txt (6.1 KB)
I need to show company name having top 10 revenue ( top 10 company name in every grid i.e. all company having revenue in top 10 wrt to segment and stage as shown above : Segment1 and Discovery stage ) The green/amber/red icon before the company name show the status which needs to be like image icon.
Any insights on this will be really helpful . Thanks