Hi,
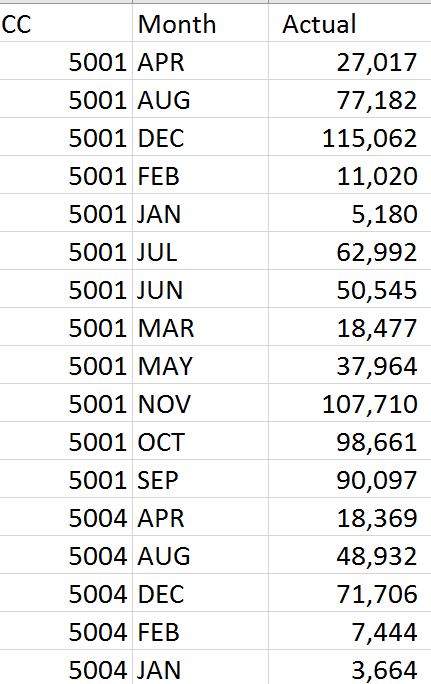
I have a simple data set that I use to mock up the budgeting exercise.
It comprises of:
CC, being the Cost Centre
Month
Amount
I managed to use the crossjoin function to create the budget, by applying a certain % change to the actual data.
I would like to see whether it’s feasible to do the following:
Apply different % to different CC
Apply different % to different time period
I have also shared the PBIX to you via email. Thanks for looking into this
Isaac
Paul
January 31, 2018, 11:12am
2
Hi,
Paul
I think honestly in this case you are better off placing this into excel and manipulating it there.
To individually breakdown all the various different variables here in formula within Power BI isn’t really that realistic.
This to me is more a data problem, which really is better solved outside of Power BI.
Power BI is great for examples that I utilized in this workshop, but changing granular detail like your attempting to do I’m not so sure about that.

