Here’s the problem: I am trying to calculate something similar to your “cumulative actual vs budget comparison”-tutorial but with a slightly different setup. Basically, my entities are projects (eg. rather than products) with fixed starting and ending dates.
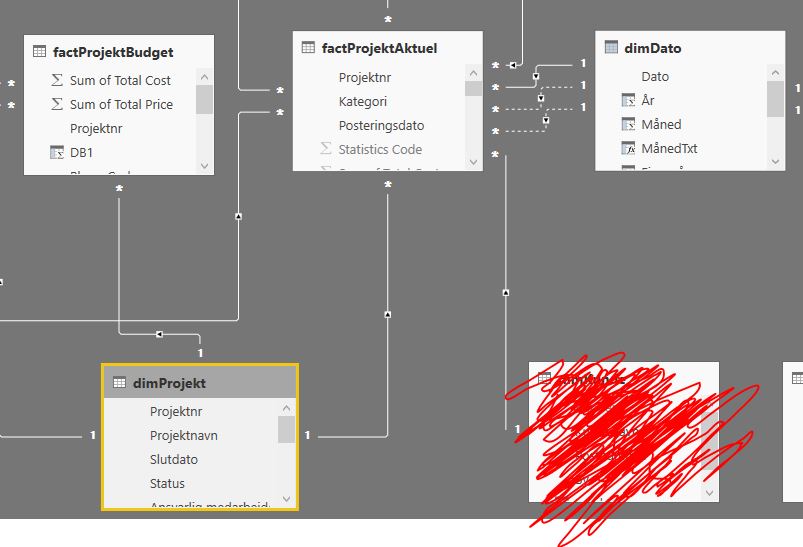
The budget is in a fact-table with project-level granularity. Fx. project A: 1,000 in various costs, project B: 5,000 in various costs, etc. The actuals are in another fact table with day-by-day accounting entries. This is all linked by a project look up table containing the starting and ending dates of each project. Further, a custom date table is linked to ending dates (for non-related reasons) but with an inactive relationship with the posting date in the actuals table. (see screen dump which is in danish but the table names should be translateable)
I’d like to create an overview that allows the user to filter on a single project in order to show a comparison between budget and actual costs displayed in a line/area chart with months on the x-axis. When no project filter is applied it would be awesome to see the comparison in totals but I don’t know if this is possible.
I’ve tried every way of applying your logic of “days in context / days in year x budget” but the denominator obviously has to express the number of days between starting and ending date of the project and I just can’t get the syntax right.
Any help or pointers towards similar issues is much appreciated! Let me know if additional information is needed.
Really difficult for me to imagine all this and attempt a solid solution.
Can you show me a formula of where you are at and what results you are getting in a table so I can see the data. Then I can likely suggest improvements to the formulas.
It’s much easier to evaluate what happens with these things available. I find it difficult otherwise with detailed data models as the image shows.
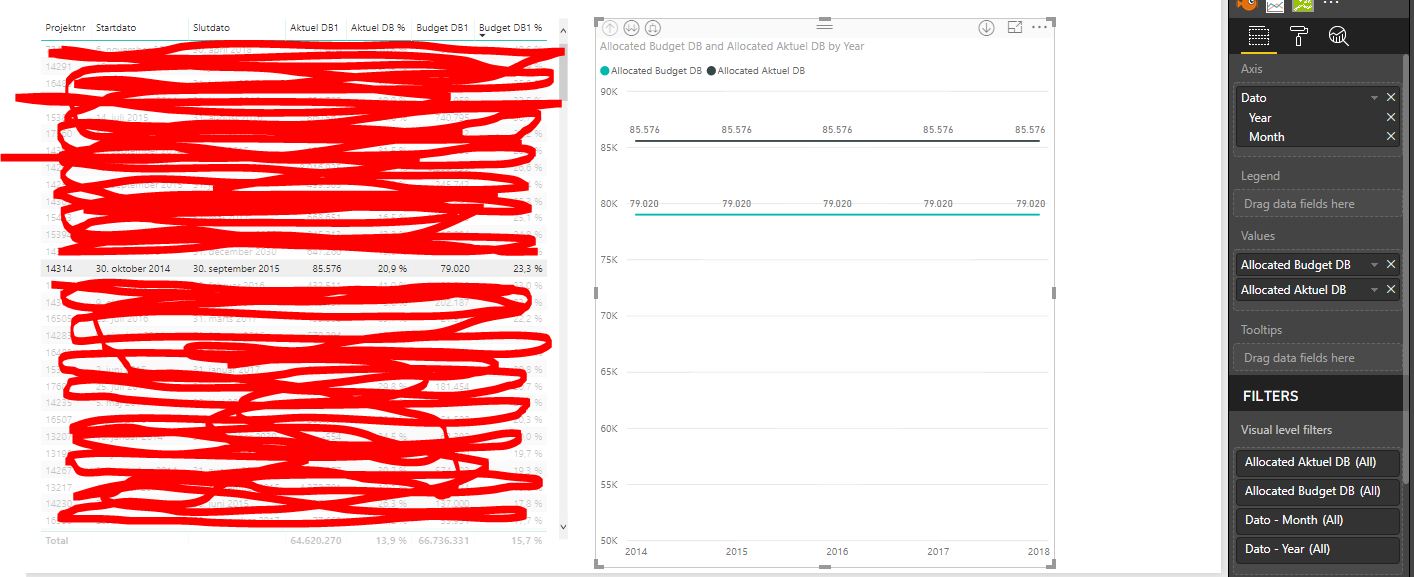
In the picture above, you’ll see a table with information from the table dimProject (Project ID, Start date, End date) and the following measures: Actuals EBIT, Actuals EBIT %, Budget EBIT and Budget EBIT %.
In the line chart to the right, I’ve added dimDate[Date] on the x-axis and the following two measures:
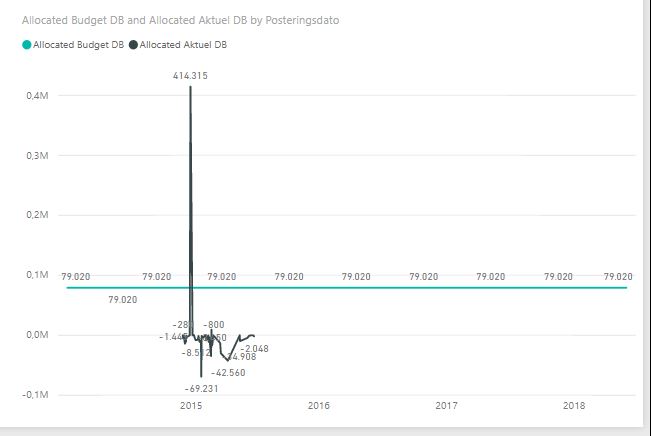
…which results in two constants. If I replace dimDate[Date] with factProjectActuals[Posting Date] on the x-axis, I get the following line chart:
Besides from the need for a bit of smoothening, actuals are looking reasonable but budget is still a constant, ignoring starting and ending dates. Obiously I have to multiply my allocated budget by a factor similar to (days in context / duration of project). This results in the following attempt:
On the axis of you chart you are using the date column from the date table but then there is no relationship at all between the date table and the budget table from what I can see.
I think it’s a simple as that. You somehow would need to create a link.
I have two link for you that I would review.
Firstly this course looks like a must do as I think your model structure could be revised a little.
Also you can actually create virtual relationships using TREATAS. Check out this tutorial here