Budget vs Actual calculations

Hi,
I have two tables.

  1. Budget File ( Columns- Material Requisition, Proposal Budget)
  2. Actual Details

I want create table which will help to compare Budget , Budget Released ( Purchase Requisition) & PO amount (Purchase order value).

I have attached expected output in excel file ( File Name- OUTPUT.XLSX).

Thanks in advance
QUERY.zip (68.8 KB)

Bumping this post for more visibility.

Here’s how I would approach this scenario. The key is to put the Budgets and Actuals into a single table. I did that using Power Query. To do that, I created staging tables for Budgets and Actuals with the same six columns:

Material Requistion No
Budget Amount
Purchase Requisition No
Budget Released Amount
Po ID
PO Amount

You can see in the Query Editor that I had to populate blank for actuals fields on my budget staging tables and vice versa. Then, I appended the two together into a single fact table.

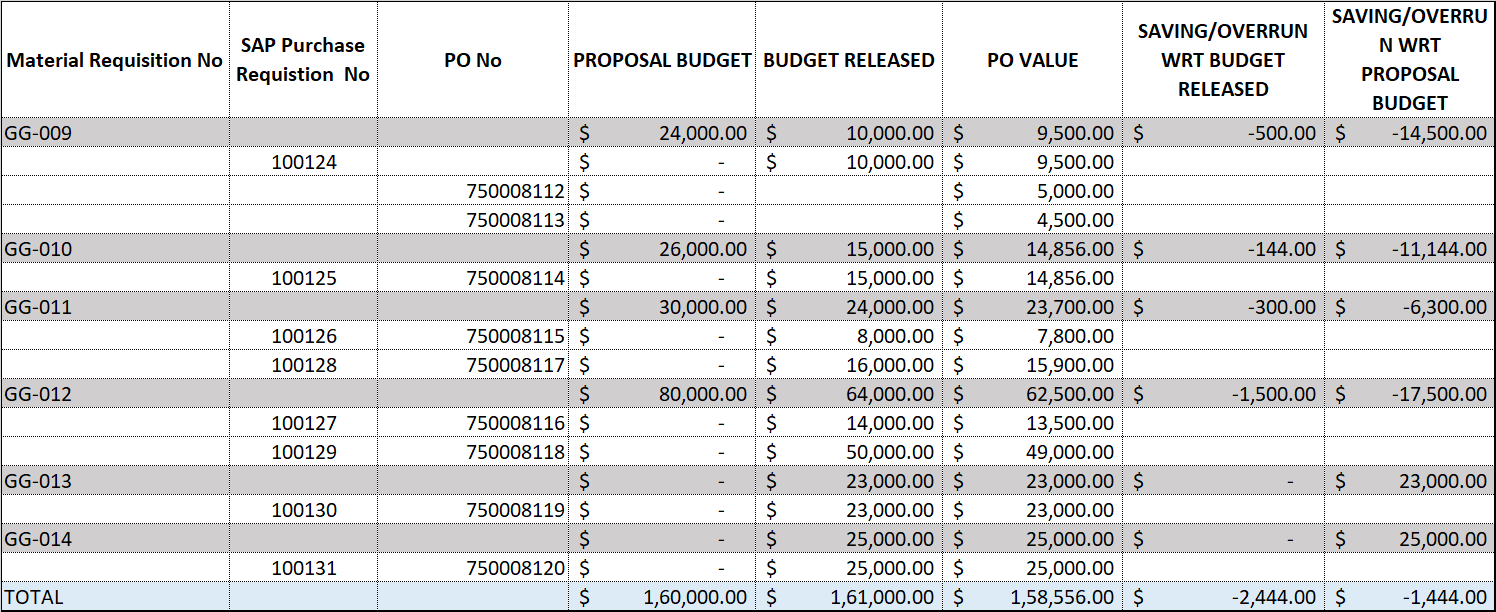
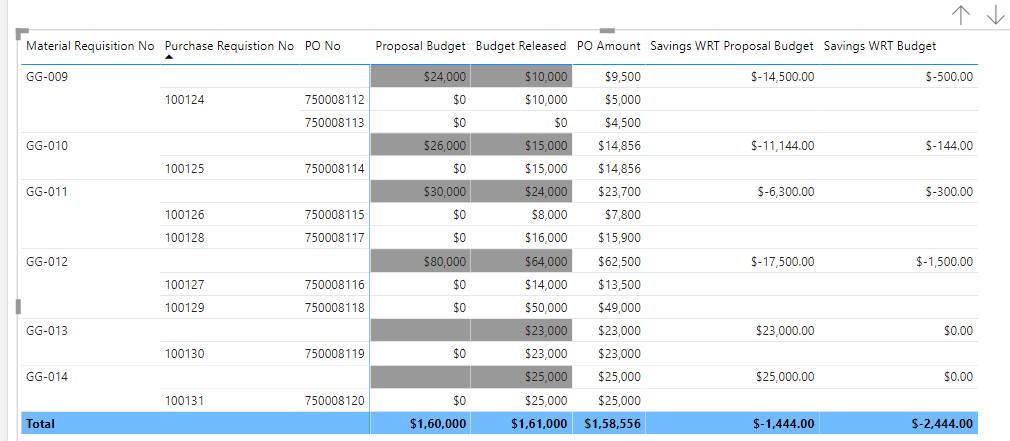
Everything else was pretty much as you did in your output file. I built the same matrix visual with the same basic key measures. The only change is to the two Savings measures. I checked if it is a total row by using the HASONEVALUE function. That really cleans up the presentation of those columns to me.

Output File MH2.pbix (30.2 KB)

Thank you for your help.

can we exclude proposal budget line from purchase requisition column ?

Yes. Here it is with that change.

Output File MH2.pbix (29.5 KB)

Dear Sir,

Thank you for your help & time.

But I am expecting output same as in attached image.

We are limited to formatting options available to us in the matrix visual in PowerBI. But, we can get it closer to looking like your Excel file. These formatting options seem to be the closest. But, you may want to play around with the subtotals options to see if there is something that you like better.

I put the subtotals on top because that is how your Excel file does section by material req no. But, then the grand totals also show on top.

Output File MH2.pbix (29.7 KB)

Hi @prafullchavan, did the response provided by @mhough help you solve your query? If not, how far did you get and what kind of help you need further? If yes, kindly mark as solution the answer that solved your query. Thanks!

It helped me to achieve similar output.

But I am expecting result as mentioned in my output excel file.

Bumping this post for more visibility.

Hi @prafullchavan1 ! We noticed that your inquiry was left unsolved for quite some time now.

We strive to answer ALL inquiries in the forum. However, if you are sure that you provided all pertinent context to your concerns and read how to use the forum more effectively and still find your question unanswered, you can check out tutorials to learn this yourself as your membership also comes with relevant resources that may help you with your Power BI education.

While our users and experts do as much as reasonable to help you with your inquiries, not all concerns can be attended to especially if there are some learnings to be done. Thank you!

Hi @prafullchavan1 - Looked into the requirment and have come up with something similar.


Few things

  1. In Budget table, there are few “Material Requisition No” missing. They need to be there to get the required format. Have added them manually for now.
  2. Have developed on top of @mhough PBIX, hence using the M Queries from there.
  3. Written few measures to get the desired values in Row themselves instead of using Sub-Totals.
  4. For Background formatting, created a measure. For sample, Done formatting for two values. can expand for others.

Attached the Solution file.

Output File MH2.pbix (30.8 KB)

Thanks and Regards,
Ankit J

Thank You