Hi,
I’ve read all the similar topics regarding subjects about “Basket Analysis”, but cant find a solution to my question.
I have built a model that consider three key metrics when evaluating association rules. Those are Support, Confidence and Lift. All of it is built with the help of this article: https://finance-bi.com/power-bi-basket-analysis/
My model checks the association in the basket analysis in regarding to different Brands that was bought together. Everything works perfectly, but now I want to take it further and would like to add some Slicers to make some filters such as Date, Country and Shop for example.
The problem is that I can’t figure out a way to create a relationship between the two tables to filter e.g. Date.
Hi @Tibbie, we aim to consistently improve the topics being posted on the forum to help you in getting a strong solution faster. While waiting for a response, here are some tips so you can get the most out of the forum and other Enterprise DNA resources.
Use the forum search to discover if your query has been asked before by another member.
When posting a topic with formula make sure that it is correctly formatted to preformated text </>.
Use the proper category that best describes your topic
Provide as much context to a question as possible.
Include demo pbix file, images of the entire scenario you are dealing with, screenshot of the data model, details of how you want to visualize a result, and any other supporting links and details.
No, think that’s fine but the forum is not an on demand service, so occasionally it will take some time to get a response.
What can help is going over the recommendations already made by @EnterpriseDNA and the forum guidelines for example to see if you can ‘improve’ your post.
Try to be precise in describing your end goal and how you intend to visualize that.
Consider breaking the requirement down into smaller pieces.
If possible give clear examples and expected outcomes.
Okey thanks @Melissa!
To further explain my end goal with the report I would like to have the visuals as is, but be able to slice by date, country and shop for example.
Since its a many to many relationship between the two fact tables i tried to do a helper table in between and connect them. Then use One-to-One and have cross-filter both. But didn’t get that to work either.
Like this example (another case but still the same thinking)
Hi @Tibbie, though we appreciate the detailed information you posted, I’m afraid this question is out of the forum’s support boundary. We would like to emphasize that the forum is not a free development service or an on-demand coaching service, asking more than one question in a forum thread and posting questions that could take hours to answer are considered inappropriate. I’ve highlighted some of the key points from the guide to define posts which are not considered appropriate:
Asking a question you know could take hours of time to answer.
Asking more than one question in any forum thread
Asking question after question in the same forum thread around the same project or piece of development work.
@EnterpriseDNA I dont understand what you mean with asking more than one question?
The ONLY question ive asked is how to connect the model so i can filter on date for example.
How could this take several hours of time to answer? And if it does, im 100% sure that it would be worth it since this example of basket analysis has a big demand for lots of different types of companies and a perfect example to update the old basked analysis-course for us members who are paying customers.
But I understand if its more convenient to answer many less demanding questions than one big one.
I’ve had a look at the thread and I can’t download the model with the link provided.
Basket Analysis is always rather complex.
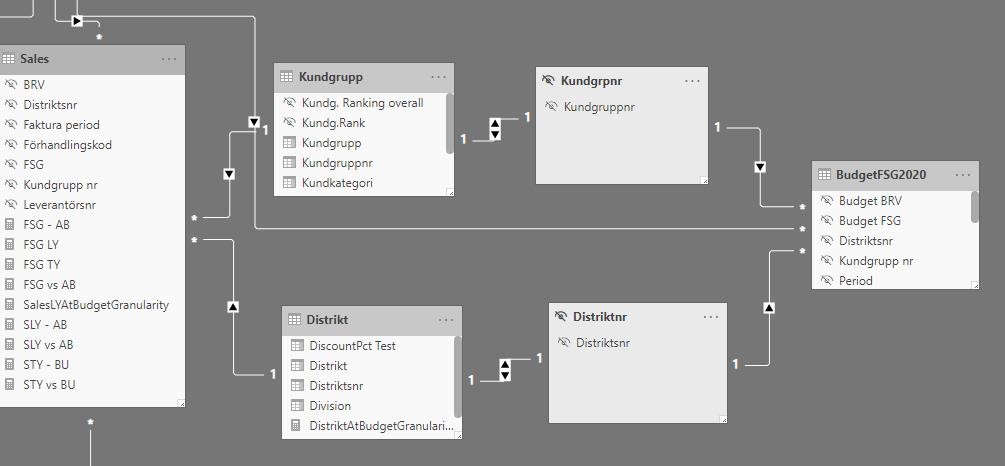
To me though the issue is your model. Currently I can’t see any best practices used at all, and this is likely why it’s difficult to understand what the issue is.
Here are many videos that should help on a few things here.
This entire course is crucial for working with the data model effectively
Also
Also on basket analysis
You also want to be looking to use the CALCULATETABLE function with basket analysis
With basket analysis a big part of what you need to master is how to compare two tables of data virtually
See here for ideas on this
One this you mention also is that you have a relationship between two fact table. In my experience this should never happen ever. So something isn’t right here with you model that needs to be optimized.
So, bit to do here.
First your model needs to be optmized and follow best practices or basket analysis is very very difficult, if not impossible to complete successfully. Once this is done your ultimate formula will be much simpler that you think.