Hello,
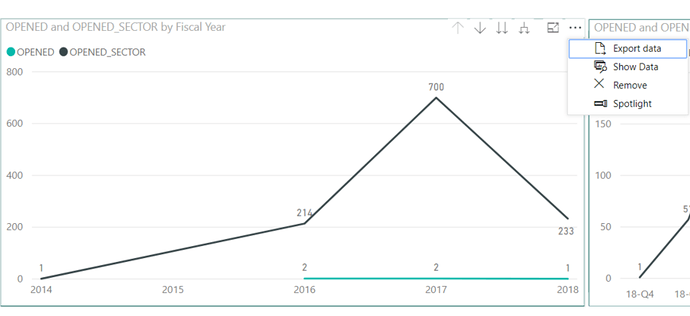
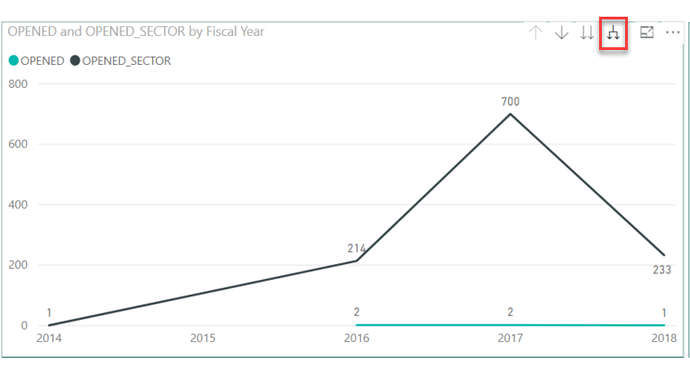
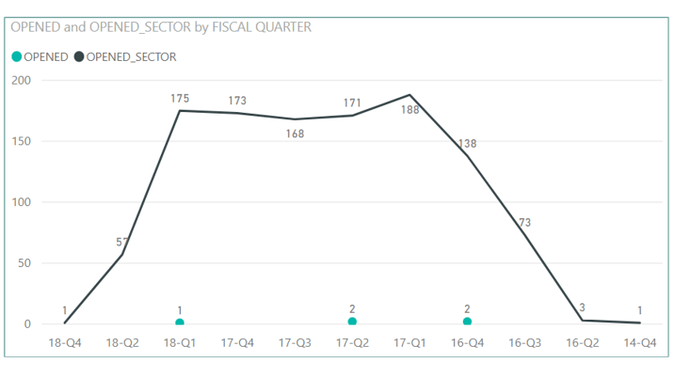
I have created a Line Chart showing the Firm Count of Cases Vs Count of Cases for Sector (all Firms in same sector).
I use the “Date” in X-axis, eg. Fiscal Year, and drill down to Fiscal Quarter.
I found the Yearly Chart, the X-axis by Fiscal Year is sorted by default in ascending order While the quarterly line chart is sorted in descending order. I would like both yearly and quarterly to be sorted in descending. Would you please advise how to achieve this? Thank you.


