Hi all,
I need your help to overcome this task.
I really don’t know how to do it.
Thanks
Regards
JoaoMonteiro
Hi all,
I need your help to overcome this task.
I really don’t know how to do it.
Thanks
Regards
JoaoMonteiro
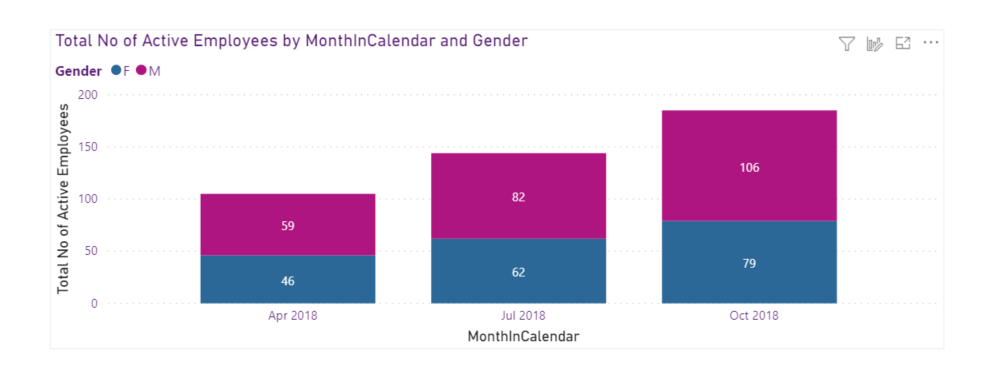
I not know sure but I understand you want to calculate Total Active Employees, I’m hope this measure will be useful for you!!
Total No of Active Employees =
VAR CurrentDate =
    MAX ( 'Date'[Date] )
VAR ActiveEmployees =
    CALCULATE (
        COUNTROWS ( RpgResources ),
        ALL ( 'Date' ),
        'Date'[Date] <= CurrentDate,
        ISBLANK ( RpgResources[ExitDate] )
            || RpgResources[ExitDate] >= CurrentDate
    )
VAR Result =
    IF ( YEAR ( CurrentDate ) <= YEAR ( TODAY () ), ActiveEmployees )
RETURN
    Result
Sample - JoseBressan.pbix (443.5 KB)
Hi @jbressan
Unfortunately I didn’t explain myself well and the solution you presented me is not what I need.
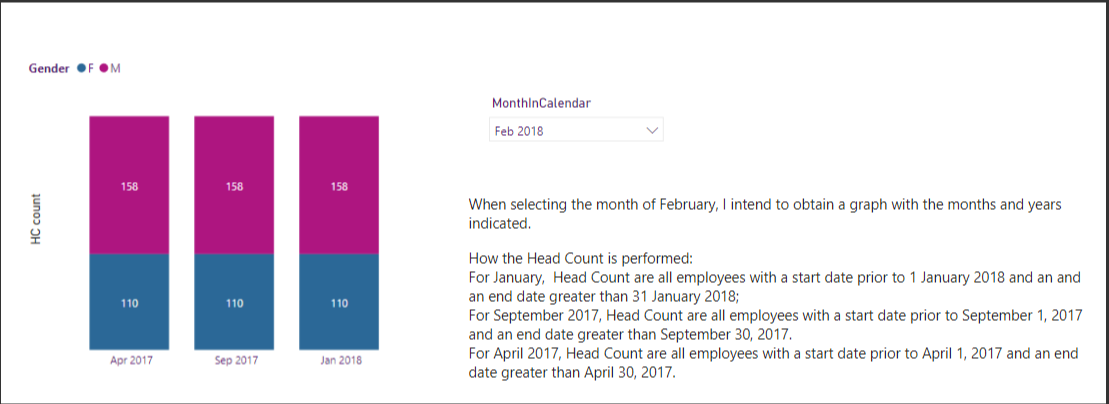
Imagine that I want the headcount for January 2018.
The calculation for this head count is all rows that fulfill the requirements:
On the image I have a better explanation.
I have made below changes in your sample. Please check if this is what you need.
Marked your Date table as Date Table
Created below measure…
HeadCount =
VAR MinDate = MIN ( ‘Date’[Date] )
VAR MaxDate = MAX ( ‘Date’[Date] )
RETURN
CALCULATE ( COUNTROWS ( RpgResources ),
ALL ( ‘Date’ ),
RpgResources[EntryDate] < MinDate,RpgResources[ExitDate] > MaxDate)
Final Solution File EDNA_Solution_HC.pbix (423.5 KB)
Hi @JoaoMonteiro, did the response provided by @ankit help you solve your query? If not, how far did you get and what kind of help you need further? If yes, kindly mark as solution the answer that solved your query. Thanks!
Hi @JoaoMonteiro, we’ve noticed that no response has been received from you since the 25th of February. We just want to check if you still need further help with this post? In case there won’t be any activity on it in the next few days, we’ll be tagging this post as Solved.
Hi @ankit
I appreciate your cooperation, but the solution you present is not what I am looking for.
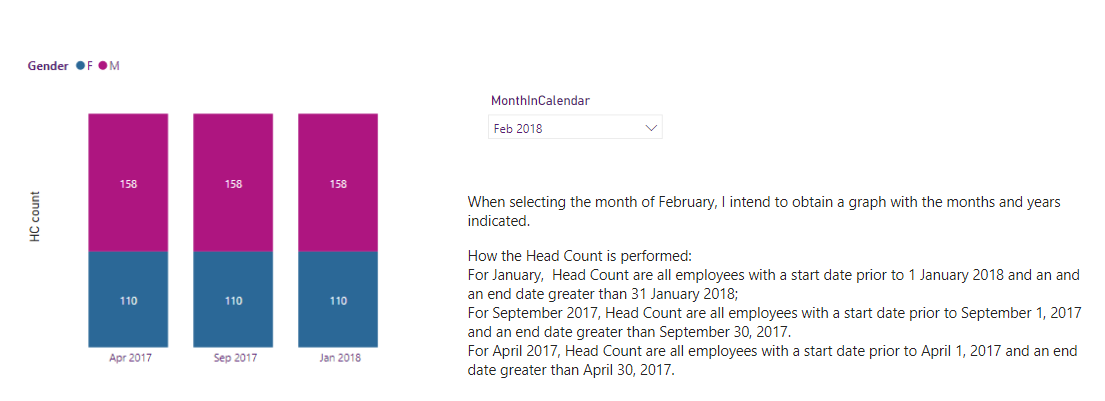
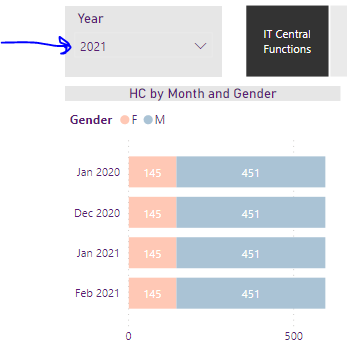
Notice the image below.
What I want is for the chart to show only certain months according to the selection made in the Year.
For example, if you select the year 2021 and we are in March, I want you to present Feb, Jan 2021 and Dec and Jan 2020; but if the user selects 2020, I just want to display the values for Jan and Dec for the selected year.
Thanks
In the initial file “Sample.PBIX” file shared there was Month & Year slicer and not any Year slicer. Solution was shared based on that.
Now, as per new requirement do let me know on what basis are you showing only specific months for different selection and how are you getting 145/451 values for all in the example provided ?
Thanks
Ankit J
Hi @JoaoMonteiro, we’ve noticed that no response has been received from you since the 3rd of March. We just want to check if you still need further help with this post? In case there won’t be any activity on it in the next few days, we’ll be tagging this post as Solved.
Hi @JoaoMonteiro, a response on this post has been tagged as “Solution”. If you have a follow question or concern related to this topic, please remove the Solution tag first by clicking the three dots beside Reply and then untick the check box.
We’ve recently launched the Enterprise DNA Forum User Experience Survey, please feel free to answer it and give your insights on how we can further improve the Support forum. Thanks!