Any Column Contains Value

I have a fact table called Sales_Orders. Columns include “Sales Order No.”, “Sale Amount”, “Inside Rep”, “Field Rep” and “Other Rep”.
I have a dimension table called Salespeople.

There is a direct relationship between ‘Sales_Orders’[Inside Rep] and Salespeople[Code].
There are indirect relationships between ‘{Sales_Orders’[Field Rep] and Salespeople[Code]} and {‘Sales_Orders’[Other Rep] and Salespeople[Code]}.

I want to create a total Sale Amount for each Salesperson, where their Salesperson Code is in any of the three columns.

Will this data model support the summary column? I’m struggling to find a way to start building this formula. I’m quite new to DAX and could use all the direction I can get as to where to start.

Perhaps I need some combination of COMBINEVALUES() and CONTAINS()?

I’m making some progress by adding columns to the Salespeople table… but let me know whether you agree with this approach;

Total Sales by Any Rep = CALCULATE(
    SUMX('Fact Sales_Orders',[Sale Amount]),
        FILTER('Fact Sales_Orders',
            [Inside_Rep]='Dim Salespeople'[Code] ||
            [Field_Rep]='Dim Salespeople'[Code] ||
            [Other_Rep]='Dim Salespeople'[Code]))

This formula seems inelegant, but it may work. I would be very interested to see other solutions. Since I need to compare multiple Sales Order values against each Salesperson value, I think adding a column to the Salespeople table may be the only way to get what I need.

@CStaich,

The easiest way I can think to do this is using the “or” operator ( || ) in a single calculated column as such:

 Any Sales Rep =
 
IF(
	Sales_Orders[Inside Rep] = Salespeople[Code] ||
	Sales_Orders[Field Rep] =  Salespeople[Code] ||
	Sales_Orders[Other Rep] = Salespeople[Code],
	1,
	0
)

You can then just calculate SUMX of Sales Amount, using Any Sales Rep = 1 as your filter condition.

Hope this is helpful.

  • Brian

P.S. depending on the structure of your data model, you may need to use RELATED in the calculated column to make the necessary linkages. If you have any problems, please just post your PBIX file so we can test the solution on your actual data/data model.

1 Like

@CStaich,

Oh, just saw your second post. Seems we’re on the same page …

However, doing it as a calculated column will make it easily reusable in the way I think you’re looking for.

  • Brian

@BrianJ,

Since this is a calculated column in a dimension table, I’m not sure how to do time intelligence on it.

I want to calculate this value on a YTD basis. How would I go about that, when the Salespeople dimension table doesn’t have a date value?

@CStaich,

If you put the SUMX within a CALCULATE statement, you can filter based on multiple conditions, so one using Any Sales Rep = 1, and one using Dates[Date] filtered on YTD.

  • Brian

@BrianJ,

I’m struggling to determine how to put these components together. Where are the formulas housed? Measures or Calculated Columns (on which table)?

Perhaps if I could see the whole formula and where it should be placed, I will start to understand.

@CStaich,

Other than the one calculated column cited above, I would recommend doing everything else via measures. If you can please post your PBIX file, I’d be glad to provide the actual measures in context using your data.

Thanks.

  • Brian

2019-12-27_CSS_Any Rep field time intelligence.pbix (100.3 KB)

I’ve created an example data model. The model very closely mimics my dataset.

I appreciate your assistance; I’m stumped over here.

I can’t get your calculated column to stop throwing an error as-is. My own calculated column [pasted below] seems to work, but can’t figure out how to add time intelligence on it.

Total Sales by Any Rep = CALCULATE(
    SUMX('Fact Sales_Orders',[Sale Amount]),
        FILTER('Fact Sales_Orders',
            [Inside_Rep]='Dim Salespeople'[Code] ||
            [Field_Rep]='Dim Salespeople'[Code] ||
            [Other_Rep]='Dim Salespeople'[Code]))

@CStaich,

I’m working on fixing some problems with your data model that will prevent your DAX from ever working properly. One question - will there always be an inside sales rep for every sale?

  • Brian

@CStaich,

For what initially looked like a fairly simple issue, this turned out to be deceptively difficult. What was challenging was constructing the data model that allowed for one, two or three different salespeople, and the sales amount being attributed individually to each one.

Here’s your original data model:

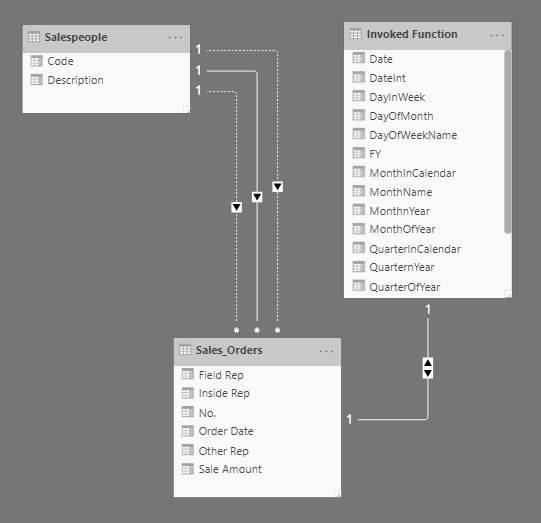
This had one minor, one major and one fatal problem:

  1. date table not marked as a date table (easily fixable, but without that the time intelligence functions will not work properly)
  2. bidirectional relationship between the date table and the fact table (bidirectional relationships should be avoided if at all possible, since they can produce unexpected, incorrect results)
  3. multiple relationships between the salesperson dimension table and the fact table - given your requirements, this structure will never produce the correct results since you always have to choose one of the three relationships as active (or activated via USERELATIONSHIP), and by doing so you will fail to capture the salespeople in the other two fields.

To remedy these problems, I did the following:

  1. marked the date table as a date table, validating on the [Dates]Date field
  2. changed the date table to fact table relationship to a one-way, one-to-many
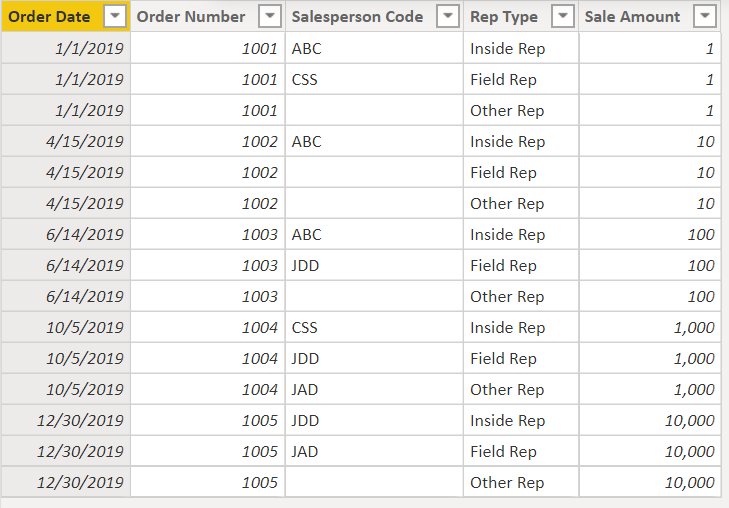
  3. in Power Query, unpivoted the Inside, Field, and Other Salespeople fields, resulting in the following structure that allowed for a single, active relationship between the salesperson dimension table and this restructured fact table:

This now results in a much simpler, cleaner standard star schema data model:

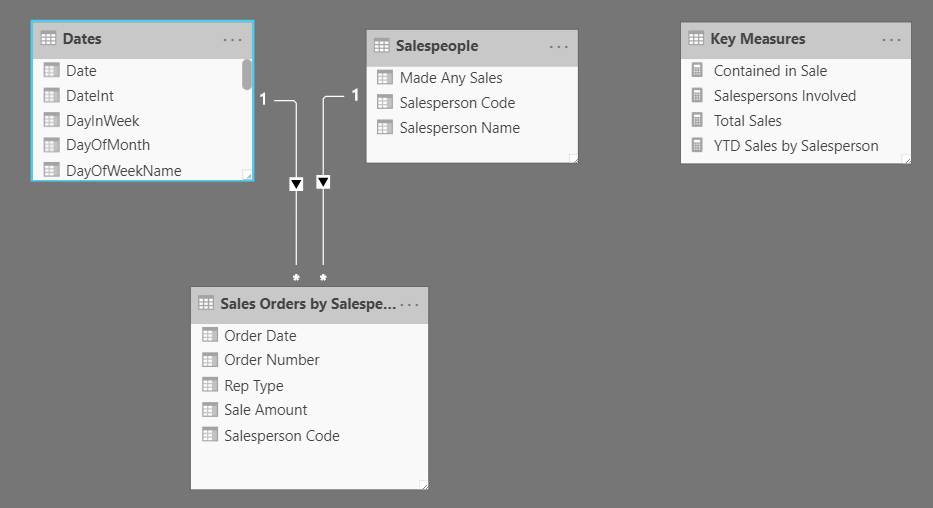
However, this is not without its own challenges, in that the sales amount for each order is repeated up to three times, depending on how many salespeople were involved in the sale. Thus if you take a simple SUM() of this column, it will contain multiple duplicate values. However, we can deal with that if needed via DAX, but the model as structured addresses your requirement well, I think.

Now, onto the calculated columns and measures.

The first one is a calculated column in the salesperson dimension table to determine whether someone made a sale in any of the three salesperson categories. You’ll see that the new structure simplifies this measure significantly relative to what we discussed above earlier in this thread:

Made Any Sales = 

IF(
    CONTAINS( 
        'Sales Orders by Salespeople',
        'Sales Orders by Salespeople'[Salesperson Code],
         Salespeople[Salesperson Code]
    ),
    1,
    0
)

Now here’s the time intelligence measure that calculates YTD total amounts by salesperson, attributing the sale to every salesperson involved, and again the revised data model simplifies this significantly:

YTD Sales by Salesperson = 

CALCULATE(
    TOTALYTD(
        [Total Sales],
        Dates[Date],
        ALLSELECTED( Dates )
        ),
    Salespeople[Made Any Sales] = 1
)

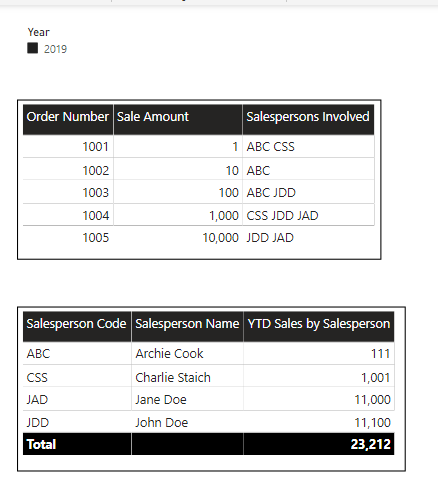
Here’s what it looks like when it’s all put together: (note that I changed your data to eliminate any sales for Xavier Zulu, in order to better test the Made Any Sales calculated column):

I hope this is helpful. Full solution file posted below.

Please give a shout if you have any other questions about this.

P.S. if you haven’t already gone through the following course, I highly recommend doing so, as it is a terrific primer on the data modeling and transformation issues discussed above:

2 Likes

Hi @CStaich, we’ve noticed that no response has been received from you since December 28, 2019. We just want to check if you still need further help with this post? In case there won’t be any activity on it in the next few days, we’ll be tagging this post as Solved. If you have a follow question or concern related to this topic, please remove the Solution tag first by clicking the three dots beside Reply and then untick the checkbox. Thanks!

@BrianJ,

This has been immensely helpful. I’ve taken your suggestions.

This was my first time using a date table, so those tips were much needed. This was also my first time needing to ‘unpivot’ columns in my tables.

Now, I’m realizing that this unpivoted table doesn’t make sense for uses other than per-rep analysis… so I’ve duplicated the query to Sales_Orders in order to use the ‘unpivoted’ version solely for this purpose. I segregated my measures on this table from the rest.

@CStaich,

Great – really glad to hear that was helpful to you. You might have noticed that the solution file I sent to you was labeled “one fact table”. I debated sending you a different solution with two fact tables - one pivoted and one unpivoted. Both are totally workable approaches, each with advantages and disadvantages – the former makes your data model simpler and your DAX more complicated, the latter simplifies your DAX at the expense of a more complex data model. BTW - very smart to group your measures in the way you described to keep straight which fact table you’re operating on.

Getting comfortable creating and using date tables is one of the most important foundational skills in Power BI. Creating a good date table and incorporating it into my data model is literally the first thing I do on every one of my reports after importing my data. Thankfully, @sam.mckay has written the M code to make creating a really detailed date table incredibly simple. I’ve attached the txt file below, and actually use it so frequently that I keep it on my desktop so that I can always find it. I’ve also attached a brief cheat sheet I developed as a reminder to myself of what all the different fields in his date table are.

The first video below explains how to use this file, and then the other links provide some additional important background.

I hope this is helpful. Please just give a shout if you have any additional questions.

  • Brian

Power BI Date Table code.txt (2.8 KB)

1 Like

What I have today is essentially an entirely separate data model for by_rep analysis, with unpivoted transaction tables. Even this doesn’t completely solve my problem, because I cannot analyze by two reps at once.

@BrianJ

I would really like to be able to filter by ‘any rep’ on my pivoted Sales Orders table without seeing any of the duplicates inherent to a pivoted table. Perhaps I need to scrap my pivoted query for Sales_Orders_by_Rep and instead opt for the more complicated DAX.

Could you point me in the direction of the complicated DAX solution? What are we looking at here?

[Edit: I want to work with my table without the need to pivot those columns. I got the terminology backward.]

@CStaich,

I went back through my files from December and found the two fact table version of the solution (attached below) that I didn’t initially send you. I couldn’t remember if I’d finished this before I sent you the one fact table version, but comparing the two files tonight, they return the same results so it looks like I did finish this one too, which includes both the pivoted and unpivoted data.

Hope this is helpful to you.