I’m working on a project and I am a bit stuck on working out a ‘capacity’ type measure that aggregates over a period of time (based on context)
So its your usual orders / stores / dates type scenario, and I have a table for each (orders being my fact table here)
My ‘Stores’ dimension is a bit complex because I have some that are open on weekend days, and some that are not.
So for each Store ID, I have a daily Capacity value, and a true/false column for whether it operates on Saturday and Sunday
What I want to calculate is the total capacity for each store over a given date range, and be able to drill up/down to a daily or weekly level, with it calculating the correct value for a week period whether the particular store is operating on the weekend or not.
To start I have a measure that counts the number of dates in the current context
Number of Dates = COUNTROWS(Dates)
Then I’m working out a basic capacity like this:
Base Capacity By Date =
VAR DatesSelected = [Number of Dates]
RETURN
       SUMX (
            'Store Capacity',
            'Store Capacity'[Capacity] * DatesSelected )
Which is okay, but not accurate enough. I tried adding another column to my Store dimension, giving the number of days per week, but I don’t think using VALUES on this column would work, i.e
    VAR DatesSelected = [Number of Dates]
VAR OperatingDays = VALUES ( 'Store Capacity'[Operating Days] )
VAR OpenDates = DatesSelected - ( DatesSelected - OperatingDays )
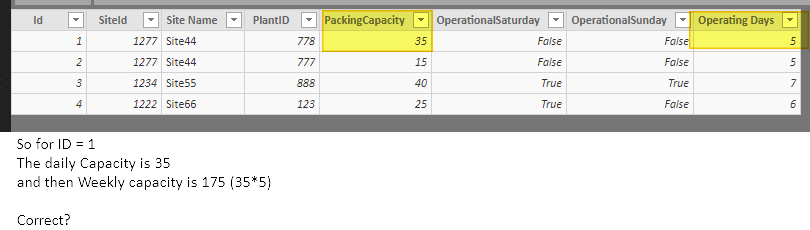
here is some sample data I have mocked up, the stores tab is the dimension, the plans tab is the fact table. the relationship here is the PlantID.
The date dimension is related to the Fact table by the PackingDate field.
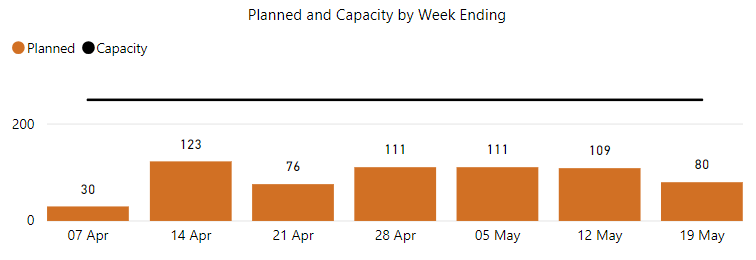
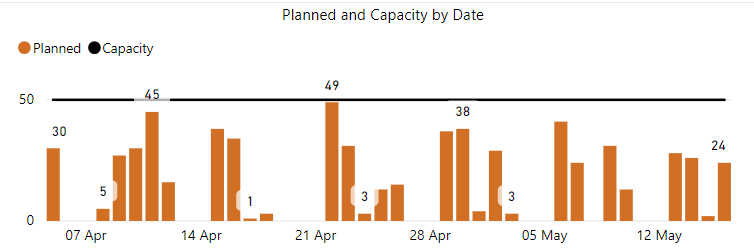
as far as a mockup goes, it want to use the capacity aggregation multiple ways, but here is an example of what is planned vs the combined capacity of all the Plants/Stores currently being shown. Two images of the same visual, where one has been drilled down further in the heirarchy of dates.
i.e. if the store isn’t operating on the weekend, its weekly capacity would be 5 * Capacity, instead of 7 * capacity like I’m getting.
@ChrisM,
Quick question. I’m not 100% clear in your sample data where the capacity is. Is it the weekly capacity in the DimStore table under the PackingCapacity column? I just want to be sure since this will be the starting point for the calculation.
The field ‘PackingCapacity’ in the stores table is the Daily Capacity - hmmm, what if we worked out the weekly capacity into that dimension table, and then switched between the daily and weekly values depending on the date context?
@ChrisM
Sorry about the delay, actually had my first kid a little earlier than anticipated so had to go radio silent there. I will have some sort of solution by end of week at the latest.
@ChrisM,
Thanks for the congrats, appreciate that!
Now back to business. I attached the pbix file below. I dont think its 100% what you want, but I think ( hope) it is close or at least something we can work with.
Quick list of things I did:
Go to Power Query and you will see a parameter for the File location. enter in the entire file location of the sample file. This will allow you to see the data in Power Query
There’s a small query that created a DimCalendar table with some additional columns. Pretty standard stuff but needed a Calendar table
A query called PreventFirewall. Probably not an issue here, but sometimes you can get an error if you dont have the correct access to source data. Basically this query gets everything from the excel file and then the FacPlans and DimStores table referenced that.
I toyed with the idea of denomarmalizing a little and putting the Capacity from DimStores directly into the Fact table, but didnt go down that route, but here’s what I got:
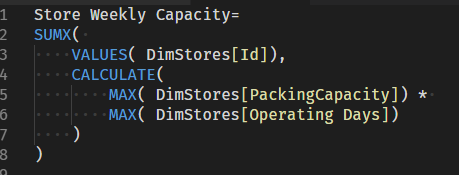
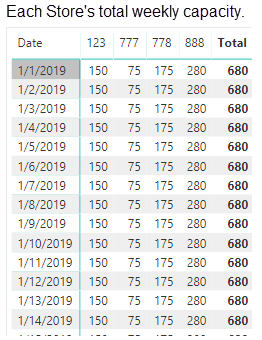
To get each stores weekly capacity: Store Weekly Capacity= SUMX( VALUES( DimStores[Id]), CALCULATE( MAX( DimStores[PackingCapacity]) * MAX( DimStores[Operating Days]) ) )
No idea hat its formatted like that, but here’s a screenshot:
produces this table:
Then to get the grand total of the weekly capacity:
Total Weekly Capacity =
CALCULATE(
SUMX(
DimStores,
CALCULATE(MAX( DimStores[PackingCapacity]))* CALCULATE(MAX( DimStores[Operating Days]))
)
, ALL( DimStores)
)
I feel like congratulations is just the start. Especially if you had an unexpected early arrival! I hope everything is going alright. Your first is always a complete life upheaval
thanks for this - I’ll have a look and let you know if I can make it work!