Aggregating days measure totals for events with duplicate time periods

Hello there! Not sure if you can get the issue from the title, so I am elaborating a bit more below:
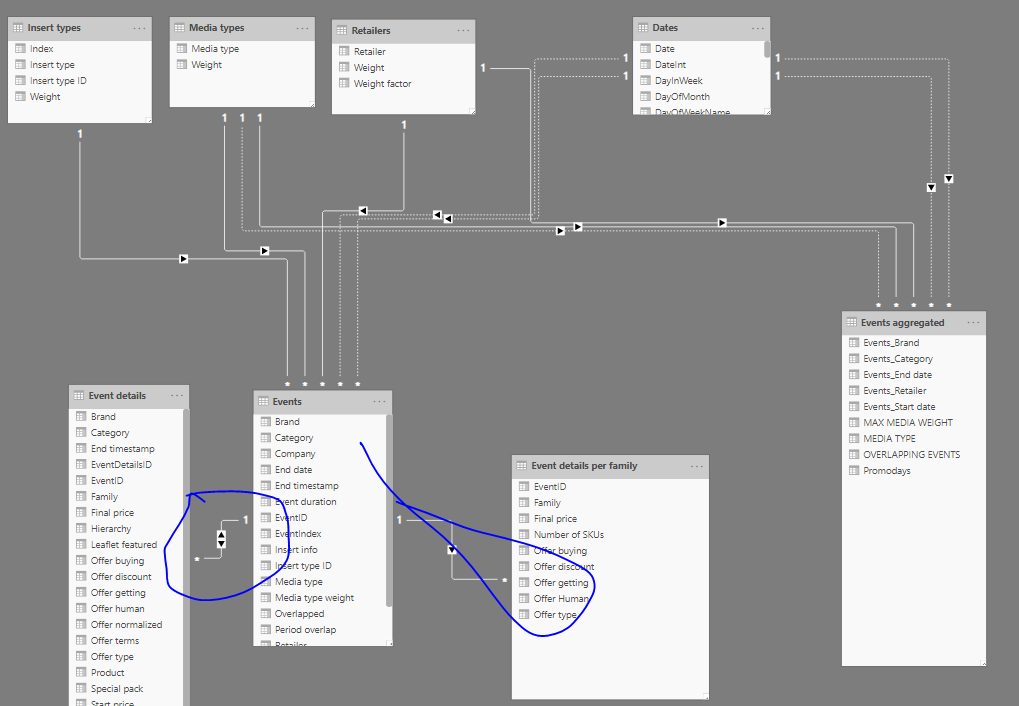
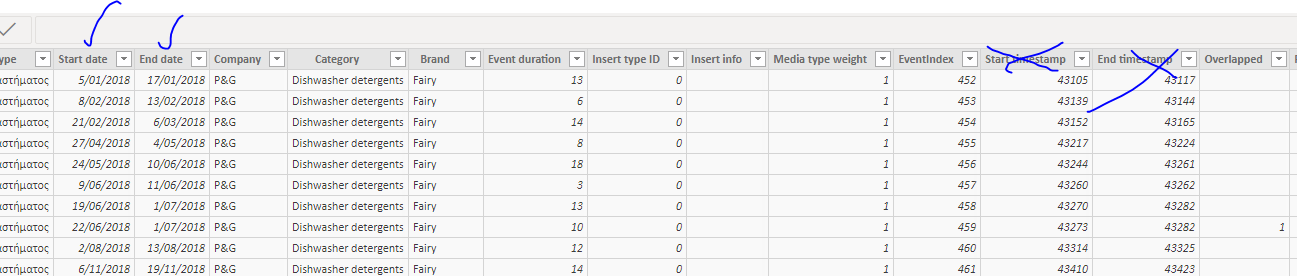
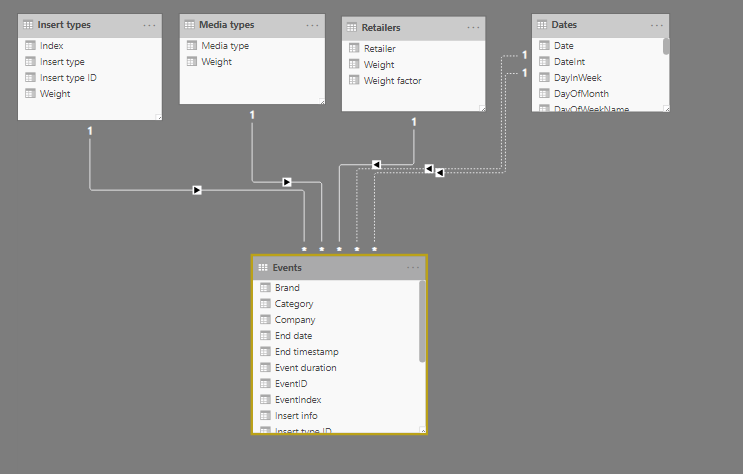
Our business case is that our model has multiple records of events with start and end dates. Events have 3-4 dimensions: Retailer,Brand, product category and discount rate.
Our main reports aggregate the events information in order to give business insights.

I am having the following challenge, when I am trying to deal with overlapping events. This means events that refer to same brand, category and retailer, in which case I don’t want to double count their duration. For example if brand X is having an event in retailer Y from Jan 1st to Jan10th and also one from Jan5th to Jan15th, I would like to receive as aggregate result 15 promodays and not 10+10=20 promodays.

The way I have dealt with this issue is the following DAX measure (not sure if optimum, but works when I view data per retailer)

Net_Promodays = COUNTROWS (FILTER(Dates,
        CALCULATE((COUNTROWS(  
            FILTER( Events, Events[Start date] <= MAX(Dates[Date]) && Events[End date] >= MAX(Dates[Date]) )
            ))> 0)
    ))

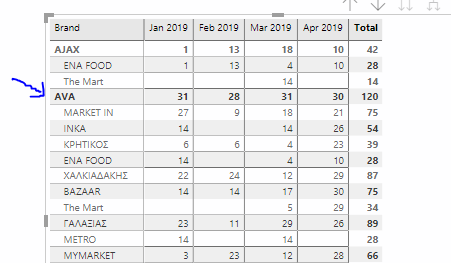
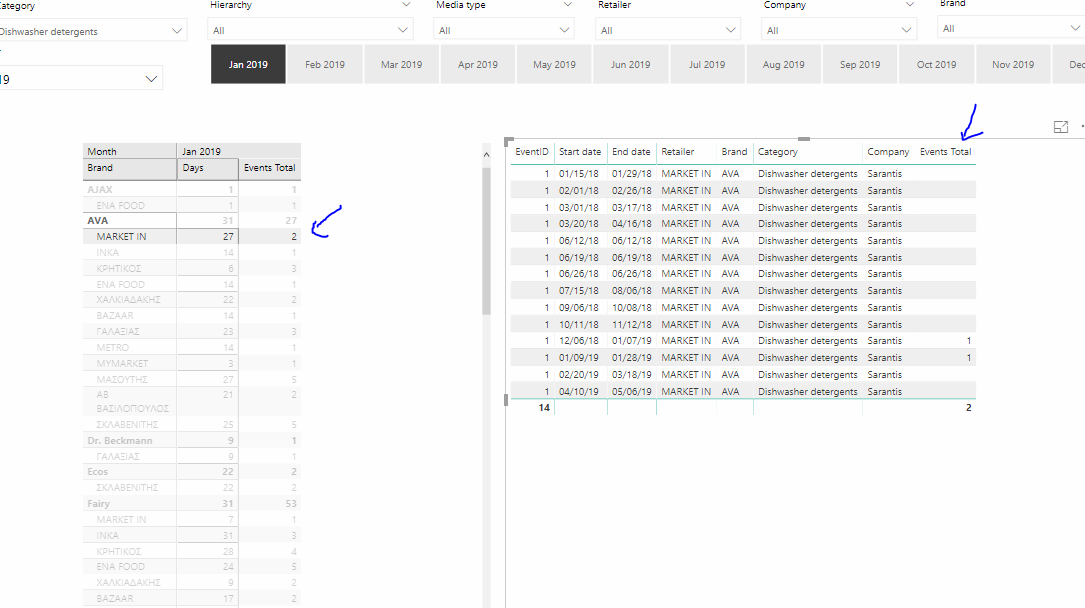
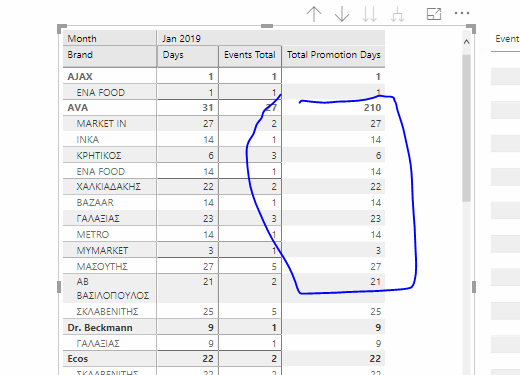
Where the problem comes up is when I aggregate totals per brand or even super totals where I get the below

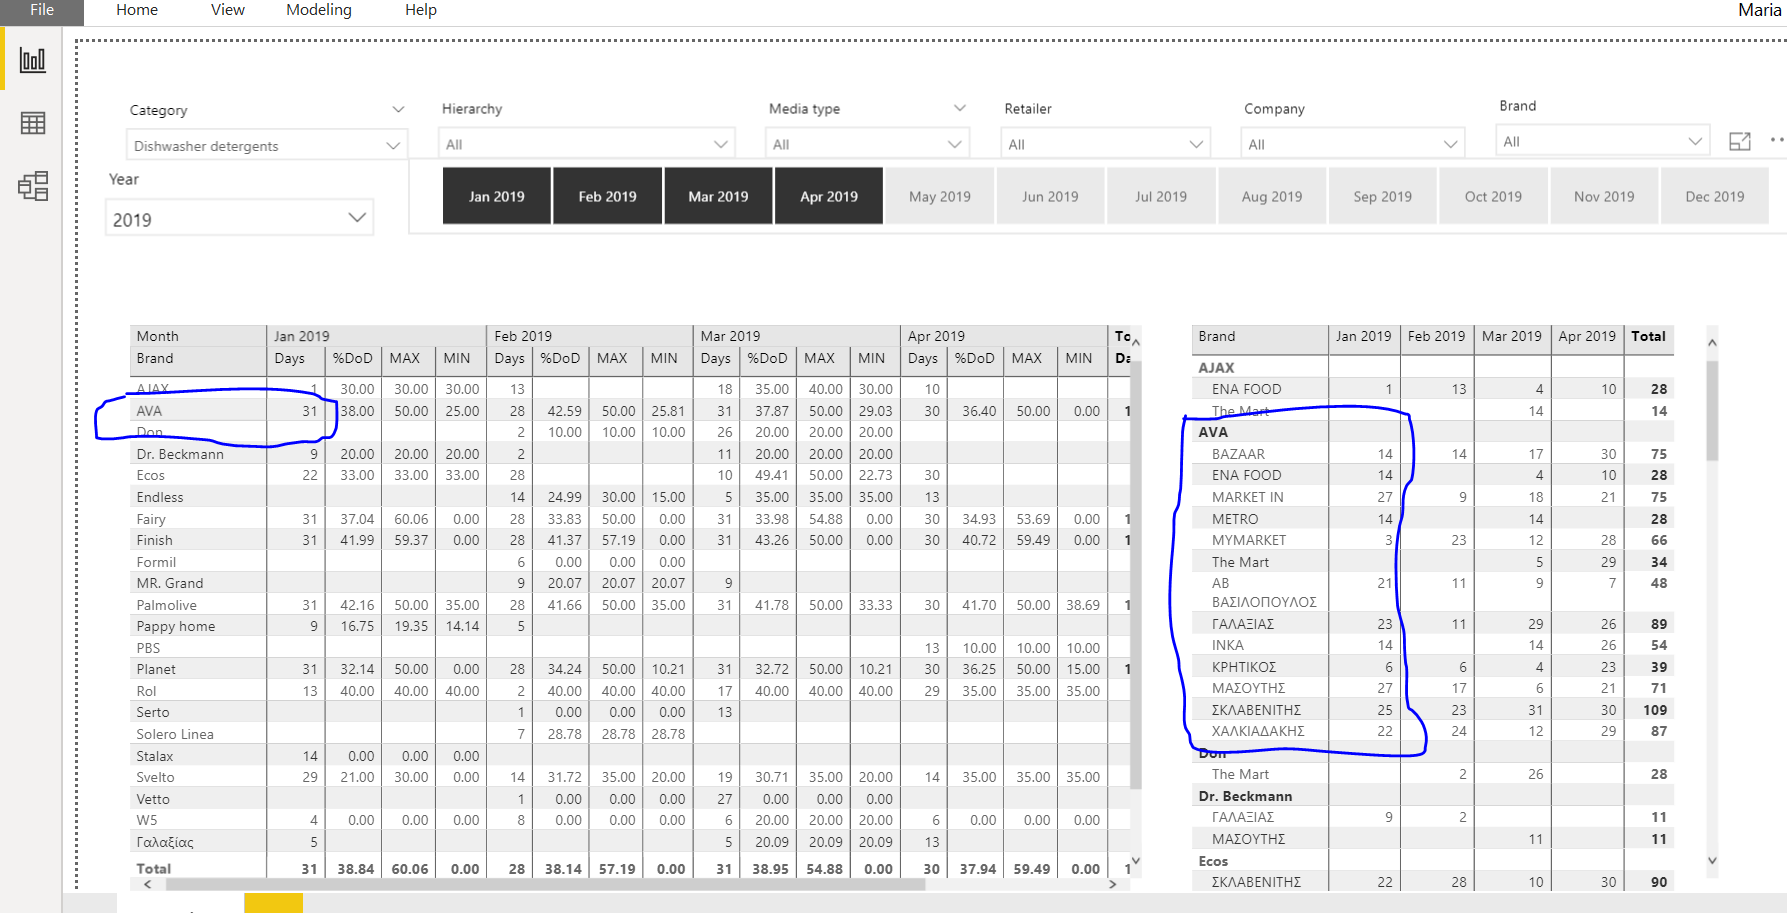
On the left side I get the wrong totals - I should get the sum of the right table, which are the net promodays for a specific brand an each retailer.

Would you have any idea on how to tackle both with 1 logic?

Attached the pbix fileDemo_SoA_Jun19_FD.pbix (958.7 KB)
Thanks & you are the best!
Zissis

Ok first thing to do here is to attempt to clean up the model a little bit.

Even when I look at this it can be confusing.

This immediately doesn’t look right because of these relationships here. I don’t believe these are required and a better setup in the overall model would fix this

I cover concepts around this in detail within this course here

I would even simplify and clean up these tables a little bit. For example do you really need these time stamps in there, as you have the dates already. This is just wasting space in your model overall.

Why couldn’t you just have a model like this?

This is what I would aim for.

So, thinking about the logic you need, you actually want to work out the first a last date of particular events only if they overlap.

Looks like you are close, I think it just comes down to the context of the calculation in your tables.

To work it out I just adjusted the matrix so that I could see everything in the one place.

image

Also, have you reviewed the events in progress pattern. I would use logic like this rather than the formula you have currently.

I created this function first to understand more around what I’m working with.

Events Total = 
CALCULATE( COUNTROWS( Events ),
    FILTER( VALUES( Events[Start date] ), Events[Start date] <= MAX( Dates[Date] ) ),
    FILTER( VALUES( Events[End date] ), Events[End date] >= MIN( Dates[Date] ) ) )

Then I set things up in a way to see exactly what we are dealing with.

In the end I just settled on a formula like this.

Total Promotion Days = 
SUMX( 
    SUMMARIZE( Events, Events[Brand], Retailers[Retailer],
        "Promotion Days", [Net_Promodays] ),
            [Promotion Days] )

image

I’m not sure if this is correct, but looks ok. You’ll have to audit it.

Attached
Demo_SoA_Jun19_FD.pbix (986.6 KB)

Thanks
Sam

Many thanks for the prompt response and the overall comments!

Indeed, the SUMX-SUMMARIZE solution you propose work perfect!
Will also take a look on the content you suggest to optimize my model.

Big thanks again :v:
Best
Zissis