Hello everybody,
i would like to share one issue, just to make sure i don’t miss anything, but an important one to cover in a report, it is about the following question:
e.g.: there is a viusal in a report, measures, showing dates, sales and whatever, how can i transport additional information to the users, like what is inculded or excluded, description how this is calculated exactly and so on. For me the information should “sit” on the visual itself?
i already use the following methods:
comments in measures (not visible for users of dashboard)
tooltip (not available in all visuals)
extra page with descritions (nobody wants to jump between pages)
what i really would like to do is place a comment on a visual, which appears if you put mouse over it, similar to “comment in excel cell”, or something like this, or else
so the really open question is, which best practices are used out there, it would be great just to get some ideas, screenshots / explanation how to get this solved
Thanks for posting your question @Franz. To receive a resolution in a timely manner please make sure that you provide all the necessary details on this thread.
Here is a potential list of additional information to include in this thread; demo pbix file, images of the entire scenario you are dealing with, screenshot of the data model, details of how you want to visualize a result, and any other supporting links and details.
Including all of the above will likely enable a quick solution to your question.
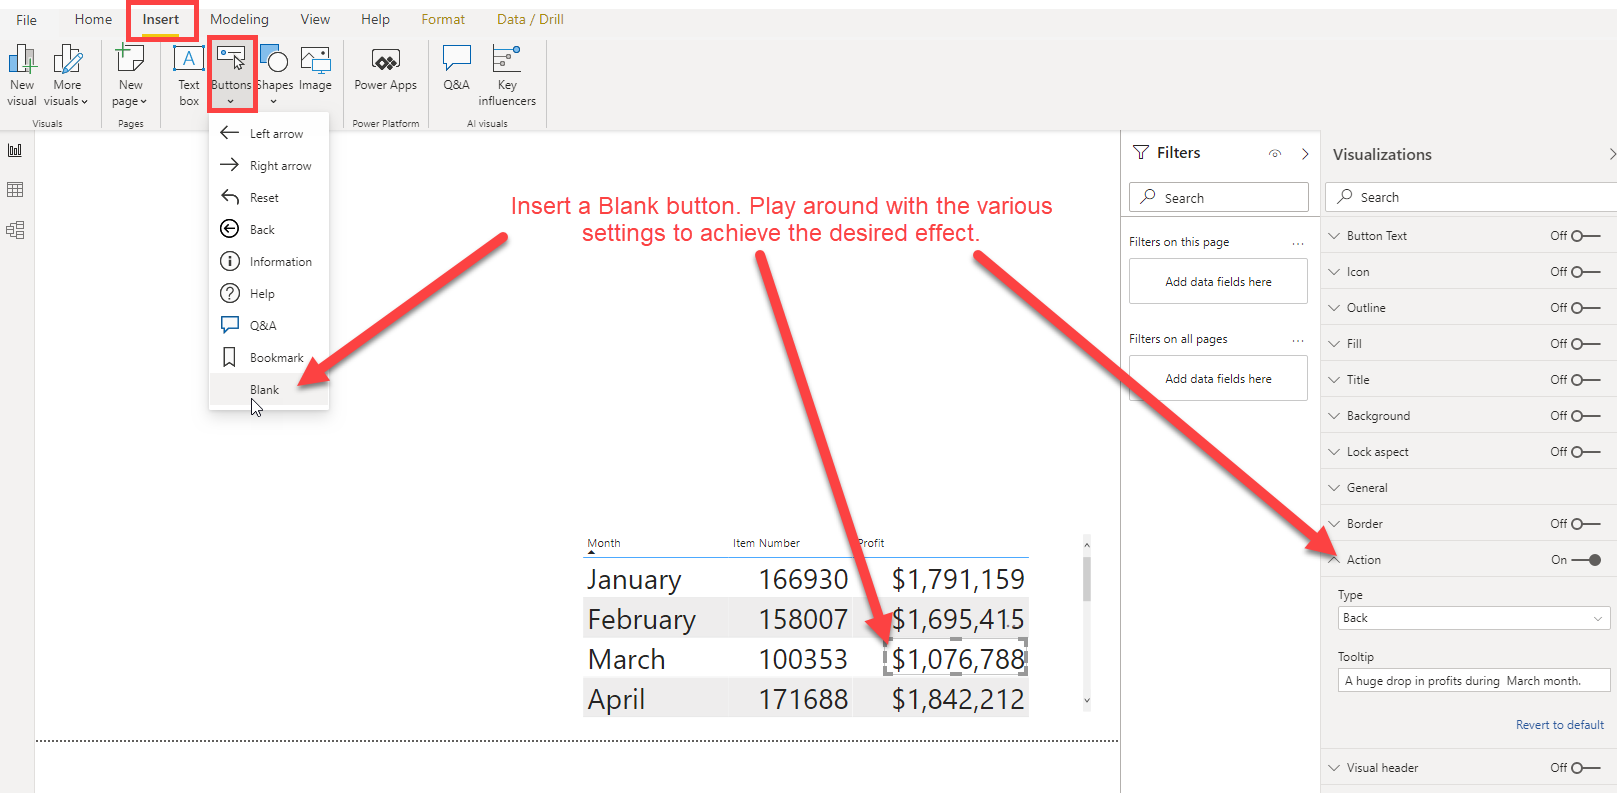
What I have for you at this time is a bit of a hack, but it can be useful when you need something short-term.
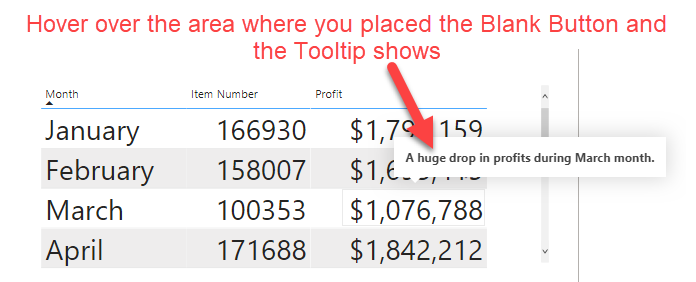
I’ve attached a couple of screenshots and a pbix file. Take note of all the different button visual properties I needed to set and I also grouped the button visual with the table visual. This does not show in Focus Mode but you can disable Focus Mode if needed.
In short, you can use a “Blank Button” Tooltip to comment on a visual, which appears if you hover the mouse over it. This is not like in Excel but an alternate option.
Like all of you, I find that the current state of tooltips in Power BI is lacking. I like the concept of tooltip report pages, but they are only available when you are hovering over a portion of a visual that represents a specific data point. I recently found myself searching for a solution to allow me to provide general help to users of a report. I ended up doing the following:
created “speech bubble” help prompts in another software package, and saved them as image files
inserted them in my report as images
created a “Help” button in the upper right corner of the report page
created a clear button with no icon and no text that covers the entire report page and is positioned above all other objects in the z-order
grouped the help prompt images and the invisible “cover” button together
created two bookmarks—one with the group made of the help prompts and invisible button showing on the report page, and the other with that same group hidden
the “Help” button triggers the bookmark that displays the help prompts and invisible “cover” button, and the invisible “cover” button triggers the bookmark that hides all the help info
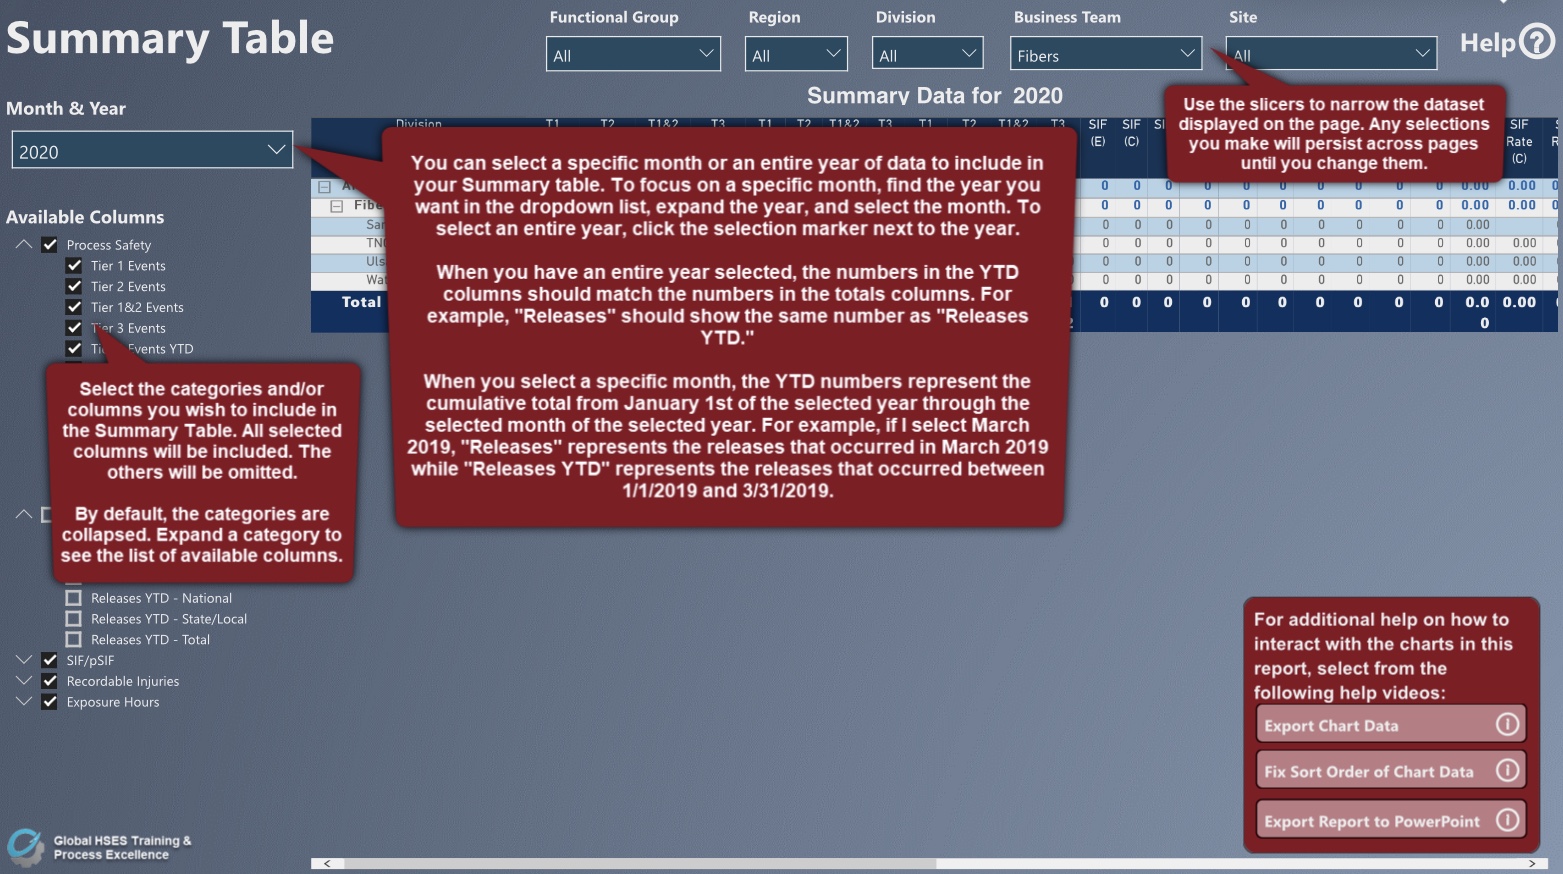
The effect accomplished by this setup is that the user clicks the “Help” button to turn on the help prompts, and then clicks anywhere on the page to dismiss the help prompts before interacting with the report—with one exception. I forgot to mention that my help info includes three buttons in the bottom right corner that link to some short videos I made to guide the user through some ways to interact with the visuals that may not be readily visible to someone who is not familiar with Power BI reports. You can see these buttons in the screen shot below. Those buttons sit above the invisible “cover” button in the z-order so they can be clicked without dismissing the help material. But clicking anywhere else on the screen EXCEPT on those three buttons hides all the help info.
I’m not near my laptop at the moment (posting this from my iPad), so I can’t share a PBIX file, but I hope this is clear enough to illustrate what I’ve done. I may try to share a redacted PBIX next week sometime if anyone is interested.
The image below shows the report page with the help prompts turned on. Not the easiest solution in the world, but it achieved the result I was after.