Hi there,
The data model of my report look as follow:
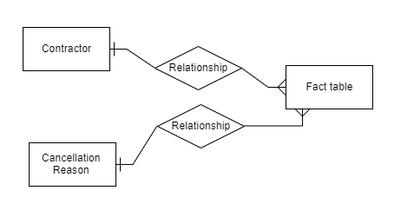
The fact table contains information about the cancelled job which includes job id, cancel date, the reason for cancellation, and contractor who cancelled the job. The contractor and cancellation reason are the dimension tables.
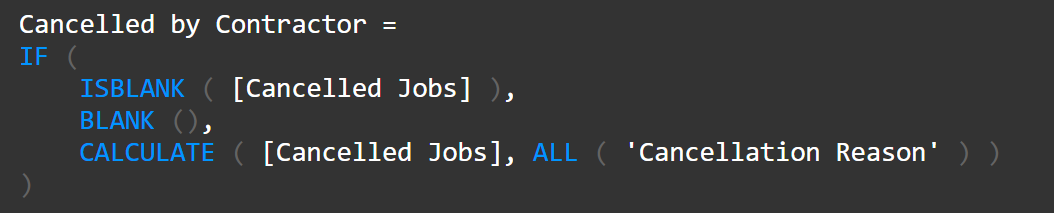
I have a measure that calculates the percentage of cancelled job. Measure looks like as follow:
% of cancelled Jobs : [Cancelled job] / [Total Jobs]
Cancelled Job = calculate(count (Table[job_ID), not(isblank(Table[cancel_job_date])))
Total Jobs = DistinctCount(Table[job_ID)
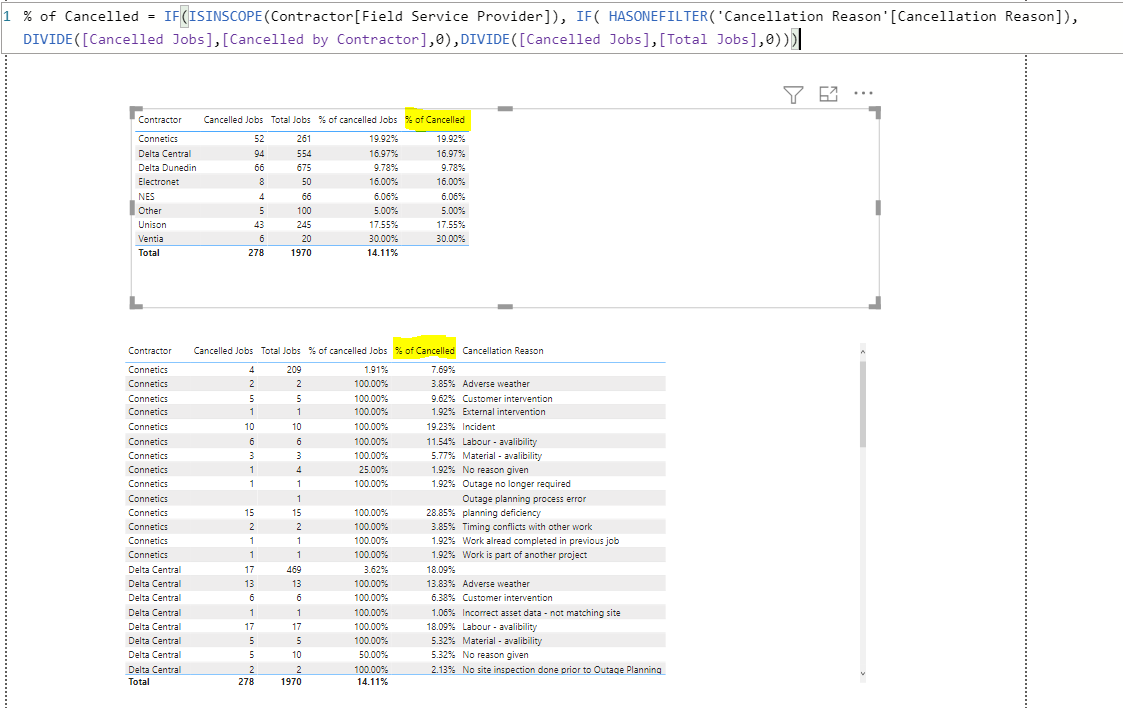
I am using table visual to display the result. The result looks as follow:
![]()
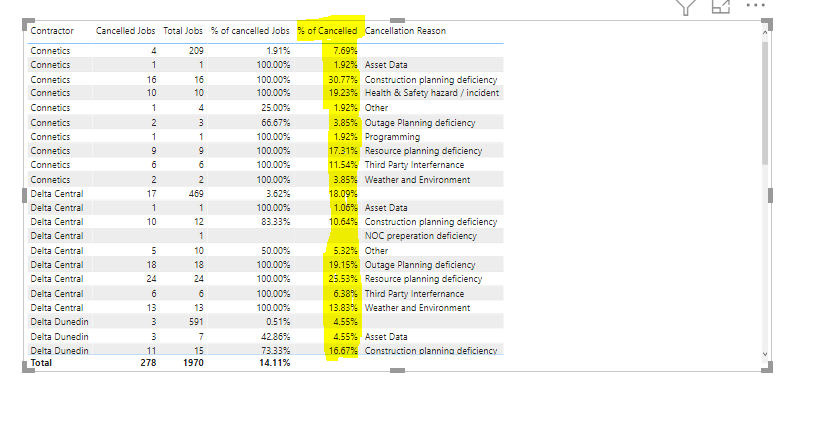
It looks fine. The problem comes in when I include the cancellation reason into the table visual (as shown in the following picture):
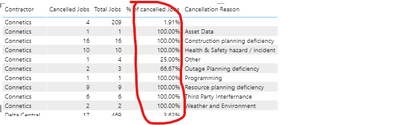
As you can see the total jobs of connectics (which is 261) distributed w.r.t to cancellation reason which disturb the [% of the cancelled job] calculation. For example, the number of cancelled jobs due to Health & safety hazard is 10, so I want to see % of cancelled jobs for that reason should be 10/52 = 19.23%, not 100% (as shown in the picture). Could anyone help me where am I making the mistake?
A file can be download from here