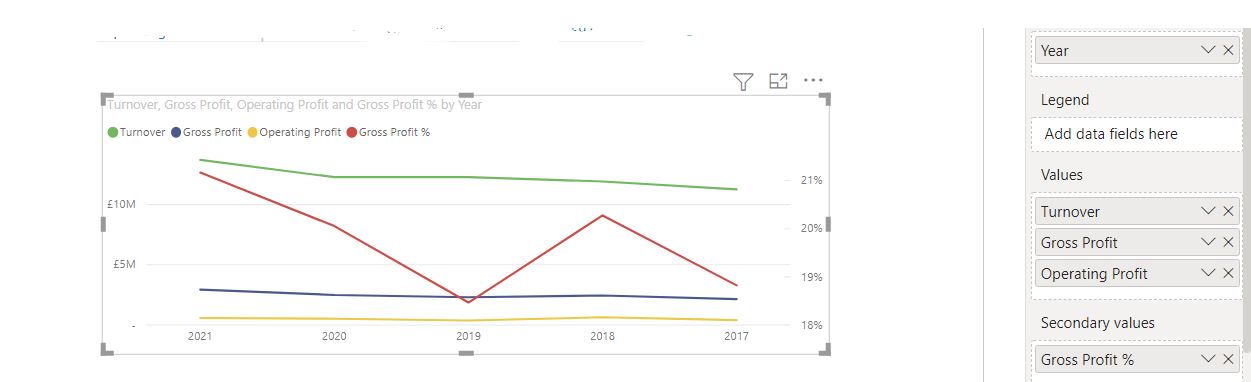
I have a visual that shows monetary and percentage values over a selected number of years 2017 - 2021 although the data in my model can go back to 2012 e.g.
I show these values on a line chart using main and secondary values. The % is the secondary value.
The model is being used by a firm of accountants to allow them to do reviews with their clients. One day they could be speaking to a manufacturer, the next a hairdresser.
I now want to introduce a constant line or industry comparative. This would be the industry average Gross Profit Percentage.
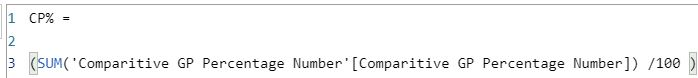
I use a parameter to capture the value and then create a measure.
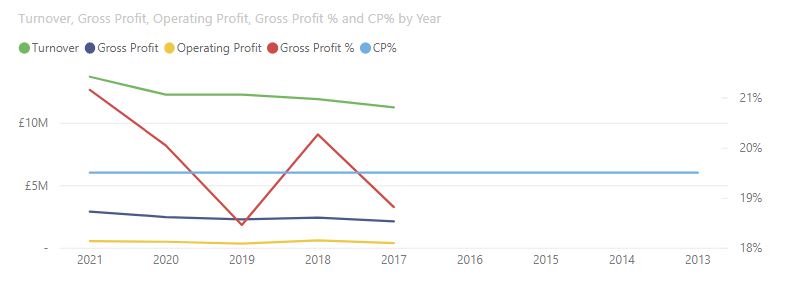
I now add the measure to the secondary value line. As I do not have any dates against the Industry GP Percentage, the chart now extends to cover all of the years that I am not reviewing.
I assume I have to introduce some sort of date restriction, or create a table for the constant value with a row per year.
WIthout a PBIX file or a mockup of exactly what you’re trying to achieve, I’m having a difficult time visualizing the scenario. However, I think since the August release finally allowed us to tie reference lines to measures and parameters, I think what you’re attempting should be doable.
See if this video helps. If not, I’d be glad to work this one if you could please provide your PBIX work-in-progress and a sketch/mockup of your desired end state.
Thank you for getting back to me so promptly. I have never shared a PBIX before. Some of my data contains some personally identifiable information. Is there a way that I can obfuscate that before I send it to you?
I have attached 3 Screenshots that will hopefully illustrate the problem.
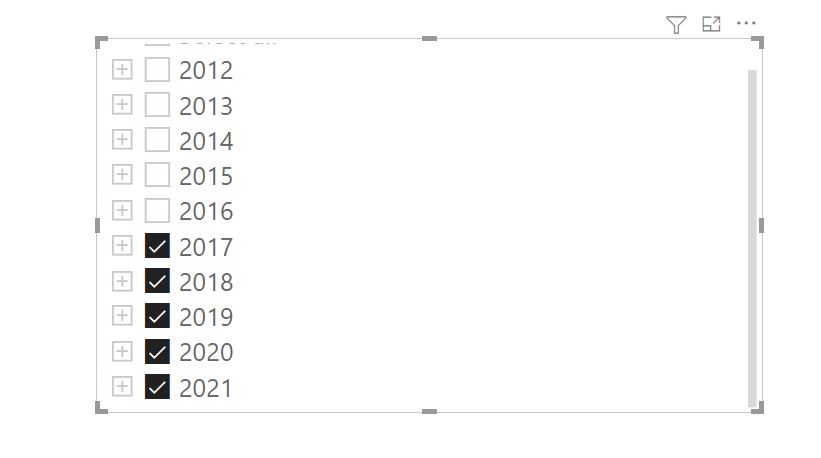
This is how the user selects the years they want. As you can there can be quite a few. (1).
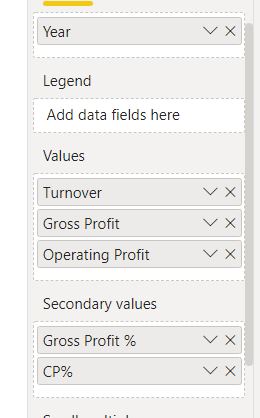
I read somewhere that I cannot use the parameter directly, so I created a measure that I can use. (2).
This is how the constant displays. Rather than the line chart just showing the years selected, it shows for every year. I assume that is because the constant is not bound by date. (3).
(4) shows the same graph with the Constant removed.
When you do that if you could also provide a sketch of the outcome you are hoping to achieve, that will ensure that the solution provided meet your needs.