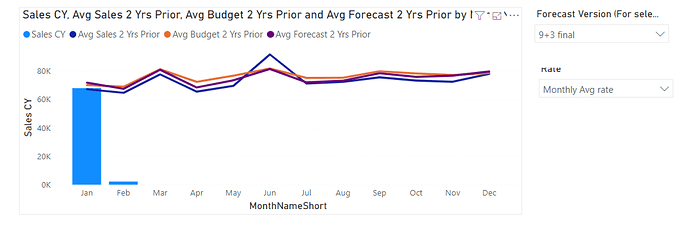
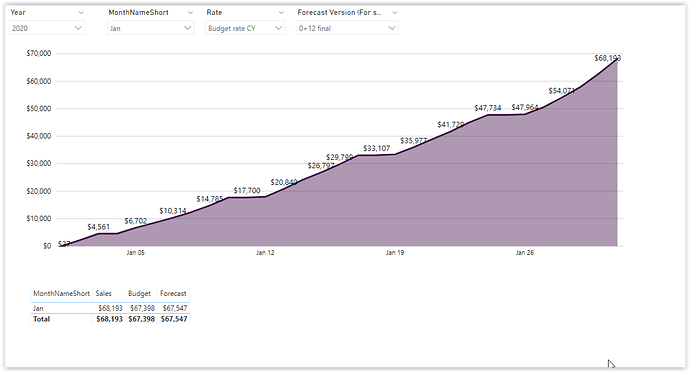
Act Sales vs Avg Sales 2 Yrs Prior curve

Hi, I’m trying to work out a scenario (which I have looked for in the forum but haven’t found).
Data is composed of three years (2018, 2019 and 2020) - Jan and Feb contains Sales 2019 and 2020

I want to showcase current year Sales by MonthNameShort as columns, and then add a line for the Average Sales 2 Yrs Prior curve by MonthNameShort.

Sales = DIVIDE( [Revenue 000’s], 1000)

Avg Sales = AVERAGEX (ALL(‘Calendar’[MonthNameShort] ), [Sales] )

Avg Sales 2 Yrs Prior = AVERAGEX ( FILTER(‘Calendar’, ‘Calendar’[Year] = “2019” || “2018” ), [Sales])

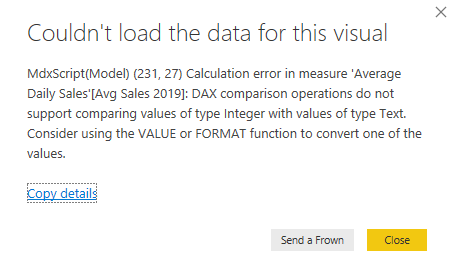
The latter isn’t working - see below error message - don’t understand since Year filed in Calendar isn’t text:
image

So, Jan should show total Act Sales as column and Avg 2 Yrs Prior as line.

Once accomplished this, I would like to show the variance in $ and % for Act vs Avg 2 Yrs Prior curve in the same visual.

Last, add countries to be able to drill down.

Greetings,
Samuel

@SamSPAIN,

In terms of the error message you’re getting, try removing the quotes from around 2018 and 2019. DAX interprets anything in quotation marks as text, so If calendar year is an integer you are creating a type mismatch, trying to compare integer values with text - resulting in the error message.

– Brian

Hi @BrianJ, just re-worked and found what I was seeking for. See below code:

Avg Sales 2 Yrs Prior = AVERAGEX ( FILTER( VALUES( ‘Calendar’[Year] ), ‘Calendar’[Year] < 2020 ), [Sales])

Now I’m seeing part of what I am after - Act Sales by month vs curve 2 Yrs Prior Act/Bgt/Fct

Need to have rate and Fct selection activated otherwise no values are being displayed.

How can I now show best variances in and % within the visual? Any hint here? Don't want 6 different formulas for each variance (3 for and 3 for % var.) but rather 2 formulas showing $ change and % change.

Also, I’d like to drill down by country but not sure how can I do that.

Much appreciated

@SamSPAIN,

It’s difficult to specifically answer some of these questions without a PBIX file to look at your data model, data and measures but I’ll do the best I can.

Need to have rate and Fct selection activated otherwise no values are being displayed.

The slicer values are providing necessary context to resolve your calculations. If you don’t want these slicers on page, you can provide this context via the filter pane or virtually in your measures using variables and/or virtual tables. However, I would definitely need to see the PBIX file to provide a more specific answer.

How can I now show best variances in and % within the visual? Any hint here? Don’t want 6 different formulas for each variance (3 for and 3 for % var.) but rather 2 formulas showing $ change and % change.

The standard Power BI visuals aren’t great for displaying variances. I would probably consider use of a custom visual here. With three different series, I would probably look to the use of small multiples rather than trying to cram everything into the same chart. This might do the trick:

https://appsource.microsoft.com/en/product/power-bi-visuals/WA104381140?tab=Overview

Also, I’d like to drill down by country but not sure how can I do that

The two brief, excellent videos below explain how to set up your drillthrough.

I hope this is helpful.

  • Brian…
2 Likes

Hi @SamSPAIN, we’ve noticed that no response has been received from you since the 6th of February. We just want to check if you still need further help with this post? In case there won’t be any activity on it in the next few days, we’ll be tagging this post as Solved. If you have a follow question or concern related to this topic, please remove the Solution tag first by clicking the three dots beside Reply and then untick the checkbox. Thanks!

@BrianJ, thanks for sharing those Guy in a Cube videos! Very helpful indeed.

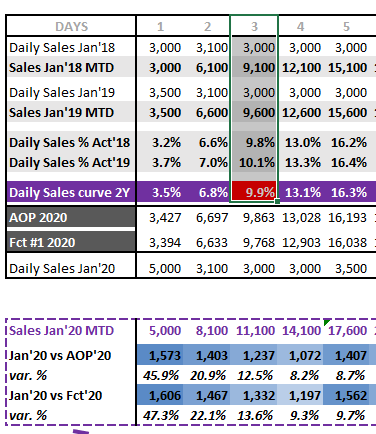
Sorry if I haven’t been concise enough. Let me try make myself clearer on what I want to accomplish.

I want to be able to calculate Jan’18 Daily Sales % contribution of Total Jan’18 (and same for Jan’19).

Considering (Jan’18 daily sales % + Jan’19 daily sales %)/2 I would get my 2 Yrs Prior Sales curve (per day).

Once this value is calculated, I would need to allocate Bgt/Fct (no daily granularity, just monthly) across the days within the month based upon this 2 Yrs Prior Sales curve KEY.

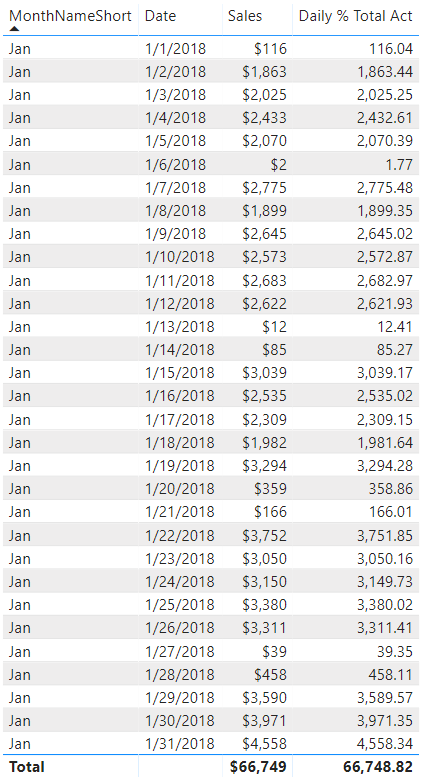
Struggling to get the Daily % Total Act (month) - tried VAR tried several calcs but due to date context I’m not getting this straight…

revenue projection.xlsx (25.5 KB)

Attached xlsx showcasing what it should look like.

Thanks a lot for your continuing support.

@SamSPAIN,

I worked up a full solution for you on this, and then left it on my other laptop. Will send to you tonight…

  • Brian

@SamSPAIN,

Here’s the measure that was giving you trouble:

Total Sales Monthly = 

CALCULATE(
    [Total Sales],
    ALLEXCEPT(
        Dates,
        Dates[Short Month], Dates[MonthName], Dates[MonthInCalendar]
    )
)

Here’s the other key measure:

Total Sales LY = 

CALCULATE(
    [Total Sales],
    DATEADD(
        Dates[Date],
        -1,
        YEAR
    )
)

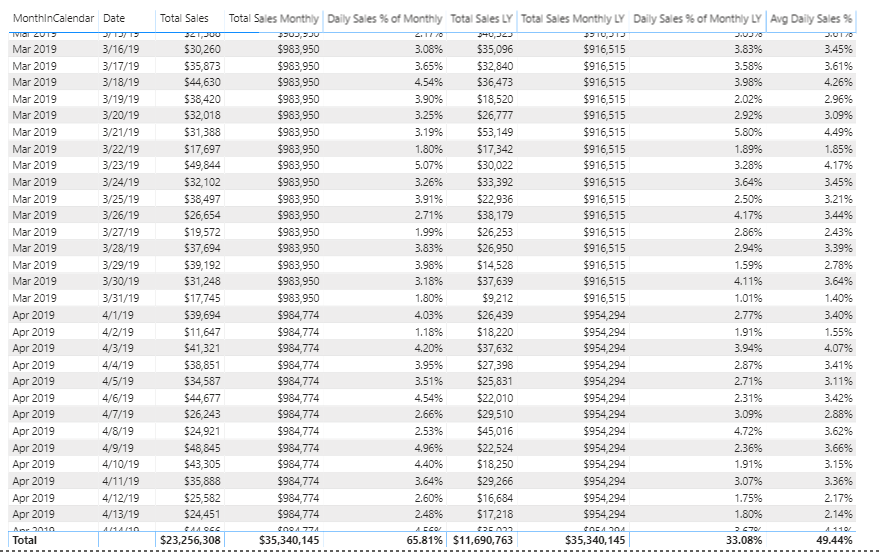
From there, it’s just a lot of measure branching:

Hope this is helpful. Full solution file posted below.

Thanks for your reply @BrianJ

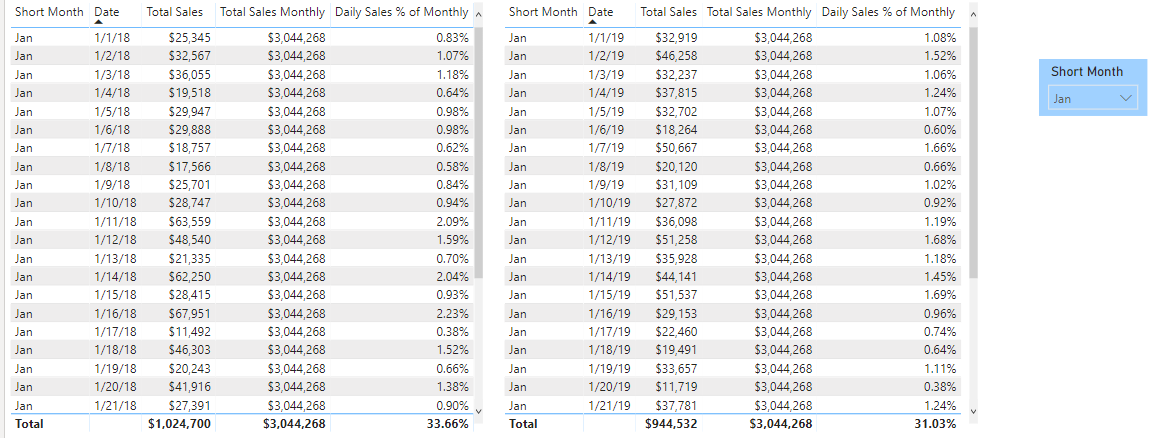
Worked out attached PBIX and code and saw that the Total Sales Monthly isn’t working - it picks up all Jan revenues (2005 till 2022) do the sum and then it computes the % (not adding to 100% as shown below for Jan):

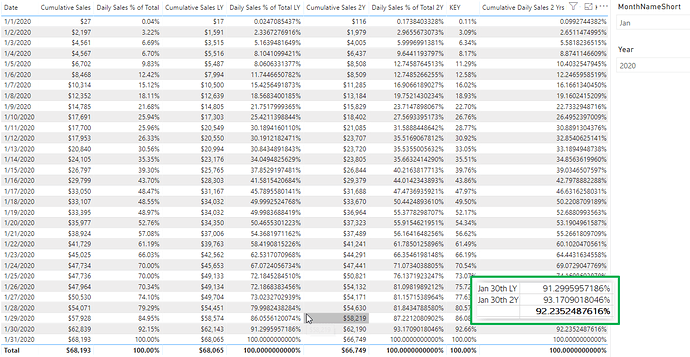
What I need DAX to do is for the selected Short Month (Jan in this case), go grab the total monthly Sales of 2 Yrs Prior (say 2018 and 2019 now that we are in 2020), then compute the daily Cumulative Sales % contribution of total Jan’18 and Jan’19 (Jan 31st of each 2918 and 2019 should add up to 100%).

Once this is done, then (Jan’18 % + Jan’19)/2 for a given day within Jan’20. This will provide the 2 Yrs Prior Sales achievement - see below for Jan 3rd for example which is 9.9%

image

This KEY would then finally be applied to AOP/Fct Jan (no daily granularity) to derive what would be our AOP/Fct daily Sales as per this calculated KEY.eDNA Forum - Avg Daily Sales Percent Solution.pbix (509.4 KB) revenue projection.xlsx (25.5 KB)

@SamSPAIN,

Short Month in your slicer is not providing sufficient context - you also need to provide a year context for the calculation. If you use MonthInCalendar in the slicer instead, it calculates correctly:

  • Brian

@BrianJ

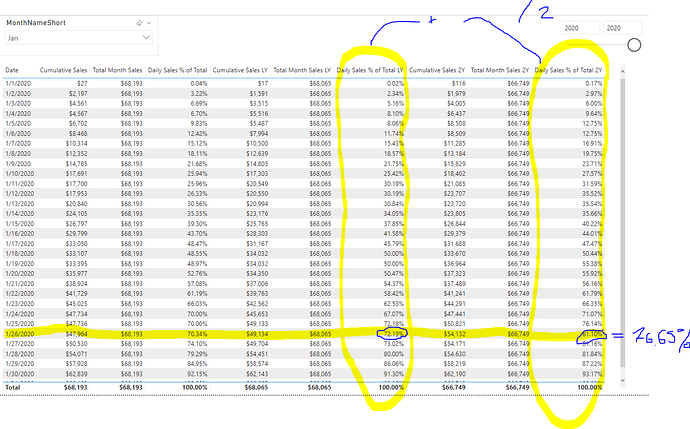
See screenshot which attempts to visualise what the goal is, debugging Jan 2 Yrs prior Cumulative Sales % of Total Month:

I came up with the following:

Total Month Sales =
IF(
[Sales] = 0,
BLANK(),
CALCULATE(
[Sales],
DATESBETWEEN(
‘Calendar’[Date],
STARTOFMONTH( ‘Calendar’[Date] ),
EOMONTH( MAX( ‘Calendar’[Date] ), 0 )
)
)
)

Then tried to compute the 2Yrs Prior Cumulative Sales % (KEY) as follows:

Cumulative Daily Sales 2 Yrs Prior Avg KEY =
VAR SalesMTDLY =
CALCULATE(
CALCULATE([Sales], DATESMTD( ‘Calendar’[Date] ) ),
DATEADD( ‘Calendar’[Date], -1, YEAR )
)

VAR SalesMTD2Y =
CALCULATE(
CALCULATE([Sales], DATESMTD( ‘Calendar’[Date] ) ),
DATEADD( ‘Calendar’[Date], -2, YEAR )
)

VAR CumulativeSalesMonthLY =
CALCULATE( [Total Month Sales], DATEADD( ‘Calendar’[Date], -1, YEAR) )

VAR CumulativeSalesMonth2Y =
CALCULATE( [Total Month Sales], DATEADD( ‘Calendar’[Date], -2, YEAR) )

VAR PctLY =
DIVIDE( SalesMTDLY, CumulativeSalesMonthLY )

VAR Pct2Y =
DIVIDE( SalesMTD2Y, CumulativeSalesMonth2Y )

RETURN
(PctLY + Pct2Y ) / 2

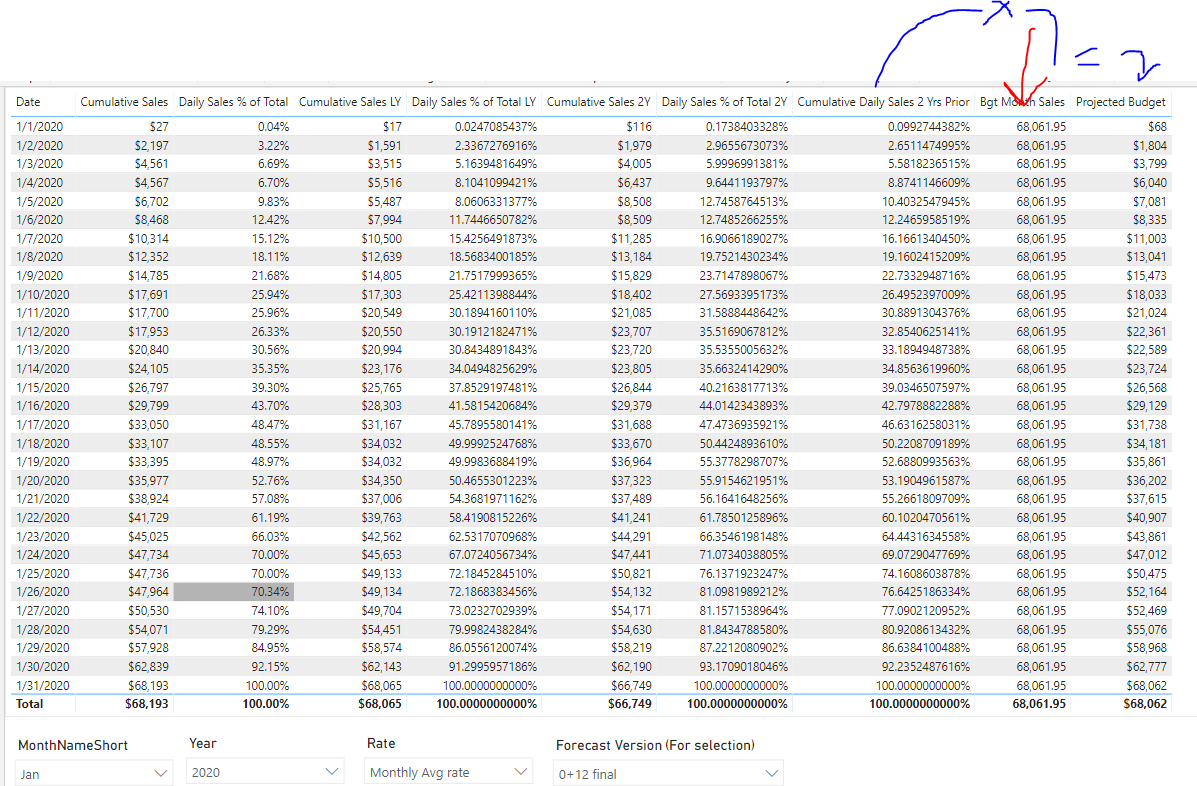
Not sure what am I missing since I’m not getting the right %… for example for Jan 26th 2020 I would compare my Actual % performance of 70.34% vs 76.65% (2 Yrs Prior Cumulative Sales curve)…

Once I sort this out, I will apply this resulting % to month AOP/Fct to allocate the amounts throughout the month.

Thanks a lot

@SamSPAIN,

Can you please post your PBIX file, so that we’re working off the same data, model, measures, etc. Thanks.

  • Brian

@BrianJ,

Attached the PBIX you shared including my calcs.

Surprisingly enough, in your file works just fine: see for instance Jan 1st 2Yrs Prior Avg Sales Curve (3.49% + 2.47%)/2 = 2.98%

2Yrs Prior Avg Sales Curve =

VAR SalesMTDLY =
CALCULATE(
CALCULATE( [Total Sales], DATESMTD( Dates[Date] )),
DATEADD( Dates[Date], -1, YEAR )
)

VAR SalesMTD2Y =
CALCULATE(
CALCULATE( [Total Sales], DATESMTD( Dates[Date] )),
DATEADD( Dates[Date], -2, YEAR )
)

VAR TotalMonthLY =
CALCULATE( [Total Month Sales], DATEADD( Dates[Date], -1, YEAR ) )

VAR TotalMonth2Y =
CALCULATE( [Total Month Sales], DATEADD( Dates[Date], -2, YEAR ) )

VAR PctLY =
DIVIDE( SalesMTDLY, TotalMonthLY, 0)

VAR Pct2Y =
DIVIDE( SalesMTD2Y, TotalMonth2Y, 0)

RETURN
(PctLY + Pct2Y) / 2

whereas it doesn’t work well in my report for Jan 1st (0.02% + 0.17%)/2 is not 0.11% but 0.09689%

Cumulative Daily Sales 2 Yrs Prior Avg KEY =
VAR SalesMTDLY =
CALCULATE(
CALCULATE([Sales], DATESMTD( ‘Calendar’[Date] ) ),
DATEADD( ‘Calendar’[Date], -1, YEAR )
)

VAR SalesMTD2Y =
CALCULATE(
CALCULATE([Sales], DATESMTD( ‘Calendar’[Date] ) ),
DATEADD( ‘Calendar’[Date], -2, YEAR )
)

VAR CumulativeSalesMonthLY =
CALCULATE( [Total Month Sales], DATEADD( ‘Calendar’[Date], -1, YEAR) )

VAR CumulativeSalesMonth2Y =
CALCULATE( [Total Month Sales], DATEADD( ‘Calendar’[Date], -2, YEAR) )

VAR PctLY =
DIVIDE( SalesMTDLY, CumulativeSalesMonthLY )

VAR Pct2Y =
DIVIDE( SalesMTD2Y, CumulativeSalesMonth2Y )

RETURN
(PctLY + Pct2Y ) / 2

How can it be possible this if the code is exactly the same? What am I missing?

This is as far as I could have reach and don’t know what else can I do…

Thanks a loteDNA Forum - Avg Daily Sales Percent Solution.pbix (530.3 KB)

@BrianJ, please disregard my prior message stating that the code didn’t work on my end.

I was applying KEY instead of the calculated Cumulative Sales 2Yrs KEY, which works perfectly well - see below audited code:

Last step is hence to apply this 2Yrs Prior Avg KEY to Monthly Bgt/Fct so that I can get my daily split based upon this KEY.

Tried following code but since doesn’t provide row context isn’t working:

Projected Forecast = CALCULATE( [Forecast] * [Cumulative Daily Sales 2 Yrs Prior] )

I removed IF statement “IF (sales=0, BLANK()…” Total Month Sales hoping that would solve my row context issue but it did not…

Total Month Sales =
CALCULATE(
[Sales],
DATESBETWEEN(
‘Calendar’[Date],
STARTOFMONTH( ‘Calendar’[Date] ),
EOMONTH( MAX( ‘Calendar’[Date] ), 0 )
)
)

Once calculated then I will be able to bring it to the visual:

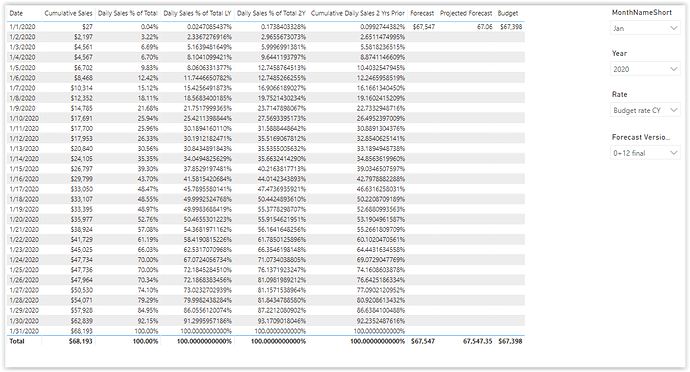
I believe I would need SWITCH function to get the full month Bgt/Fct amount for every day (since Bgt/Fct are monthly values are only displayed for the first day of the month - Jan 1st in this case), hot sure how can I accomplish this though. You see in the 2nd picture that only Jan 1st gets allocated by the 0.0992 KEY

Your support here will be much appreciated.

Many thanks Brian

@SamSPAIN,

Sorry, but I think we are out of sync again on these files and I’m having a hard time following exactly what you’re looking for. I’ve tried to find the [Forecast] measure in any of the downloaded files I have in order to try to fix the row context problem in Projected Forecast, but can’t find it, nor can I find the [Key] or [Budget] measures.

If you can please post the PBIX that the graphic below is generated from, I’ll take another run at this tomorrow.

Thanks.

@BrianJ, we are not out of sync, and I’m afraid I cannot share the PBIX.

Now all I need to know is how can I input total monthly Bgt/Fct figures to every single day within the month. Again, Bgt/Fct figures are monthly, not daily (you can see total Bgt/Fct for the month appears under Jan 1st (we’re still analysing Jan).

So essentially, what I’m after is some sort of SWITCH function whereby for blank Fct/Bgt day (all of them expect first day of the month), I can input the monthly Bgt/Fct.

All days would show then $67,547 (Fct) and $63,398 (Bgt).

Once I have this I will be able to allocate these totals based upon the Cumulative Daily Sales 2 Yrs Prior KEY.

Would you be able to provide any hint as to how can I retrieve total month Bgt/Fct for every single day within the month?

Hoping I’m making sense here and my Q is crystal - let me know if otherwise.

Thanks

@SamSPAIN,

Thanks for the clarification. I think I have just what you need below. @melissa and I worked out two different solutions to this issue with another member last month. Both approaches provided will do I think exactly what you need, but hers wins on style points with a very cool use of the DATEADD function to solve this problem.

  • Brian

Thanks @BrianJ,

At the end I managed my self to cope with it - it’s way more simple that what you and @Melissa worked on @Bare request.

Bgt Month Sales =
CALCULATE(
[Budget],
DATESBETWEEN(
‘Calendar’[Date],
STARTOFMONTH( ‘Calendar’[Date] ),
EOMONTH( MAX( ‘Calendar’[Date] ), 0 )
)
)

Same for Fct to be able to compute Projected Fct based on Total Fct month times 2 Yrs Prior KEY