A new time measure to support multiple shifts (dates) data lookup/Retrieval in my case?

Hi, there, I am looking for help & guidance to solve this problem. At the same time, also looking for training materials recommendation around this topic as I find my understanding around this time measure/slice context is pretty weak.

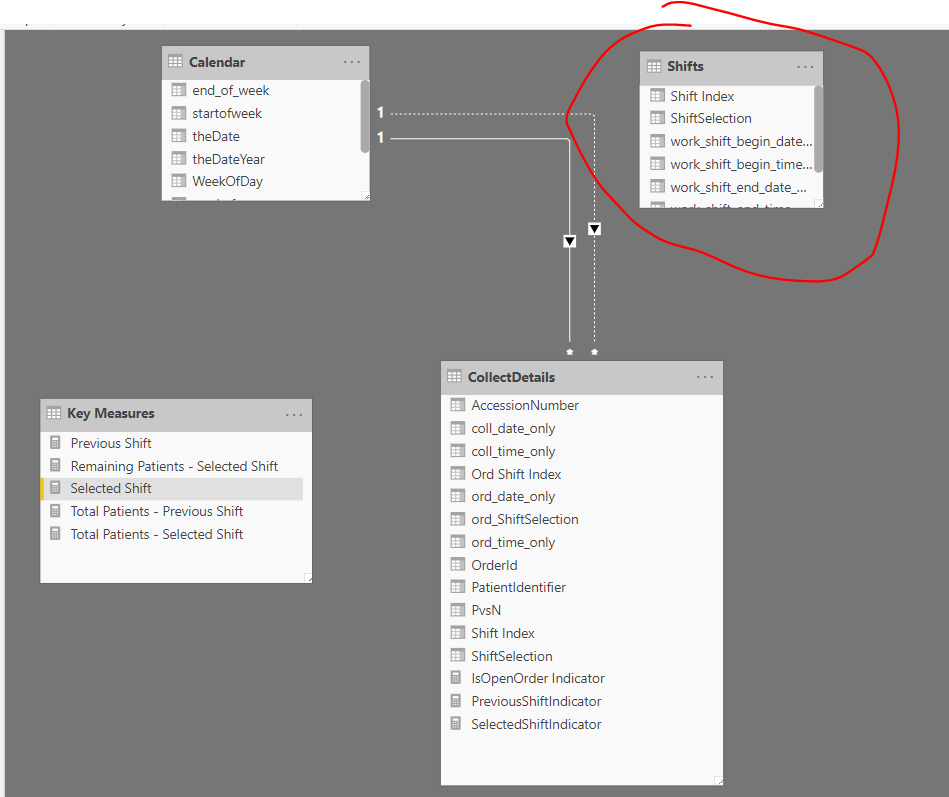
Currently I have a report to show current selected shift vs previous shift (Sam helped me with this too).
This has been working out great.

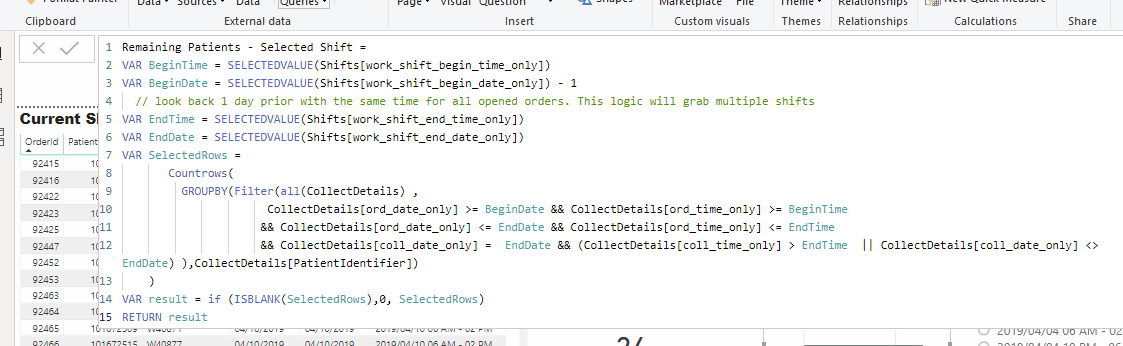
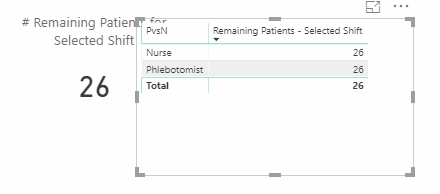
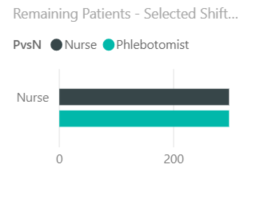
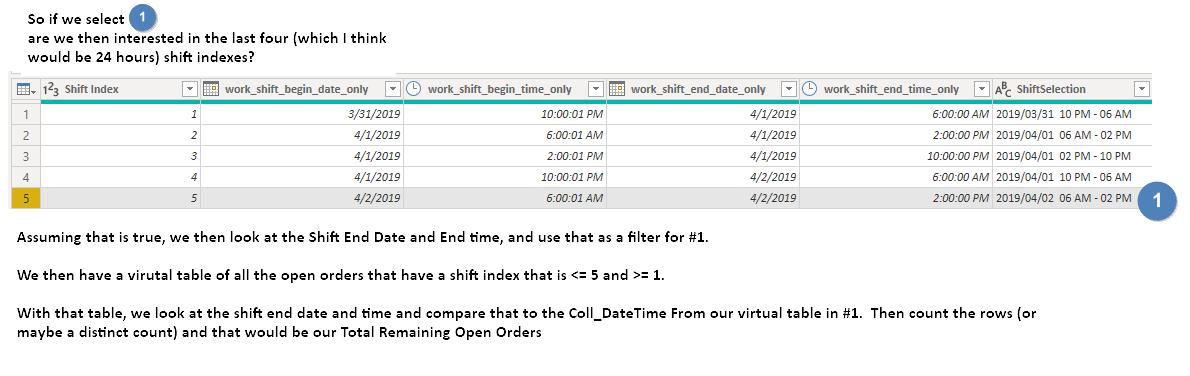
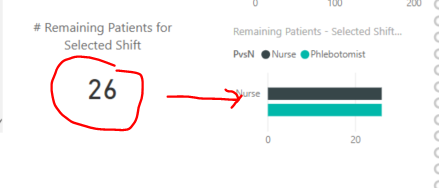
Now I need to throw in a new requirement to compute “Remaining Patients” and also to see the numbers break down between Nurse & Phlebotomist, for some reason, the calculated #s are same for all categories. This compute relies on Ord-date & ord-time (ord = order)

image

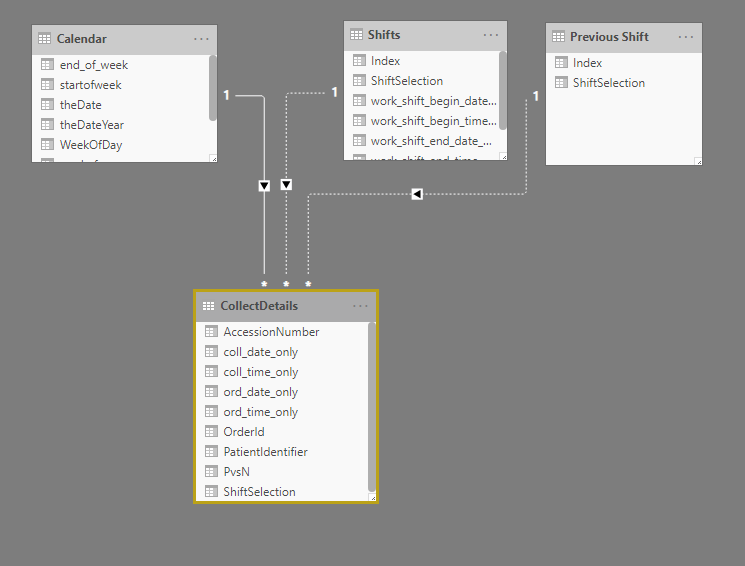
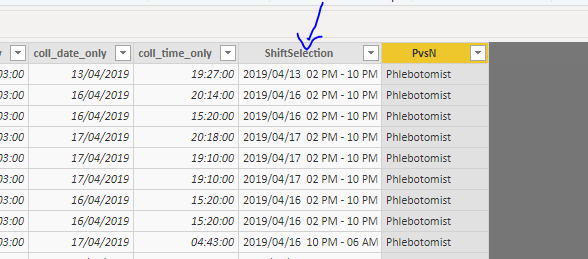
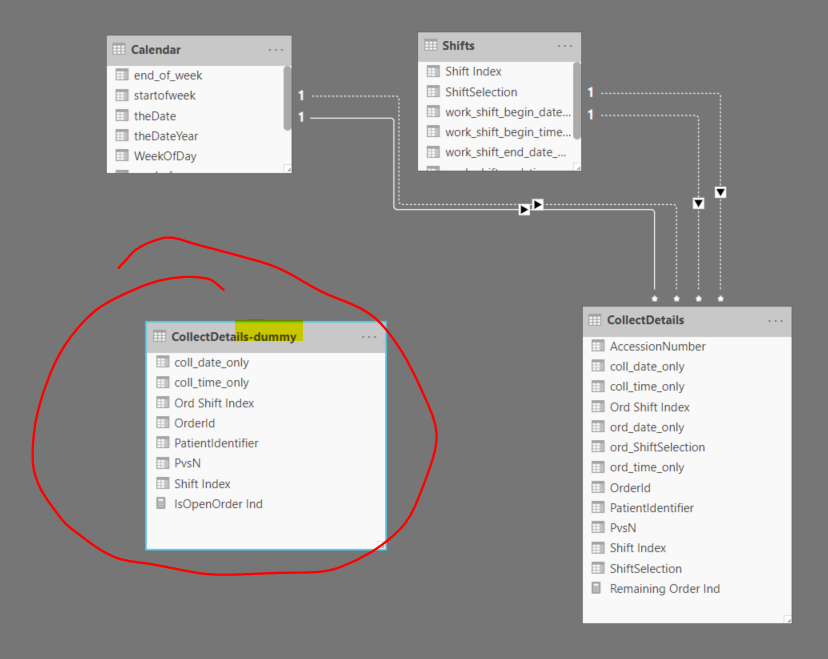
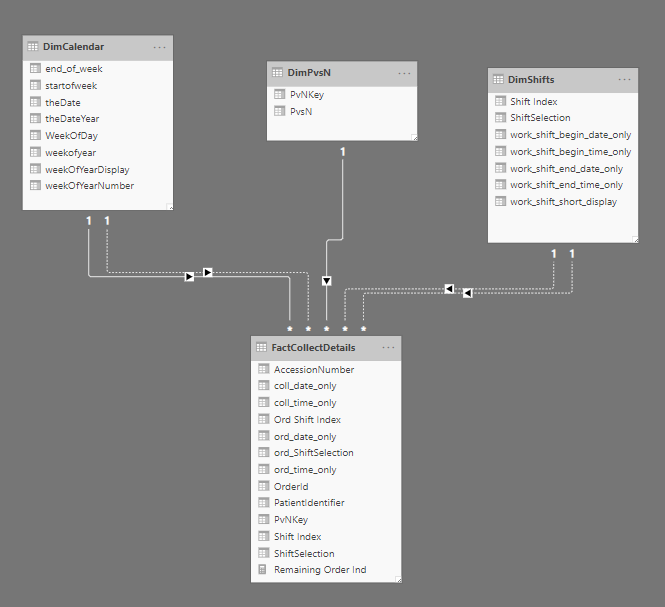
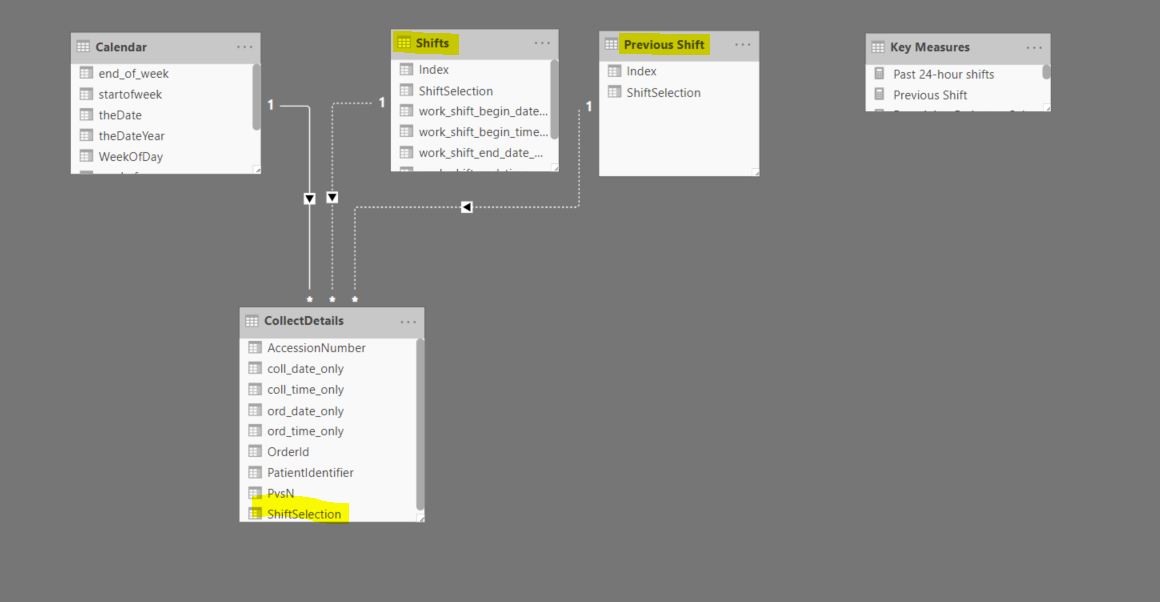
based on the current vs prior shift logic that recommended by Sam, I think the only way to fix this problem is to model the data to have the capability to slice based on ord-date. Currently the shift information is generated based on Coll-Date & time (collection date)

Hence to fix this, I would need to
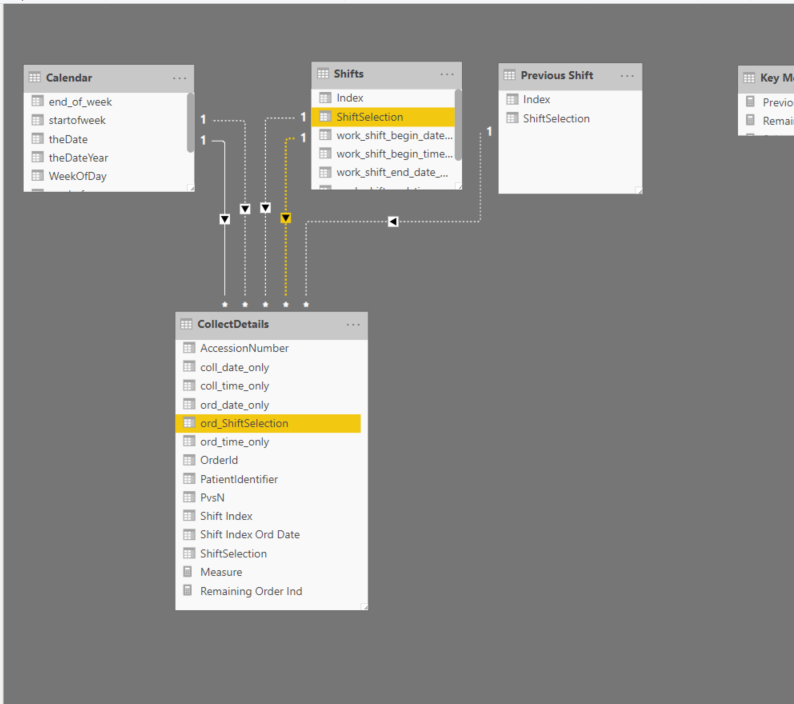
1- rename CollectDetails[ShiftSelection] to be CollectDetails[coll-shiftSelection]
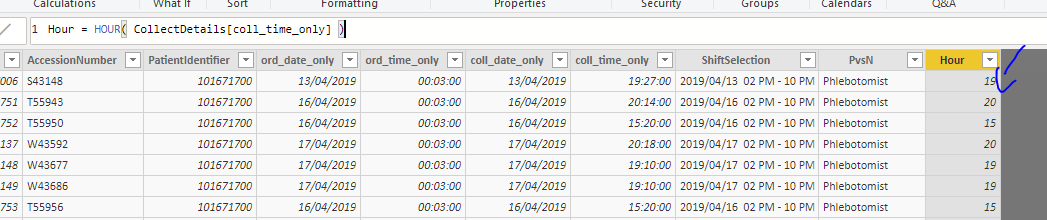
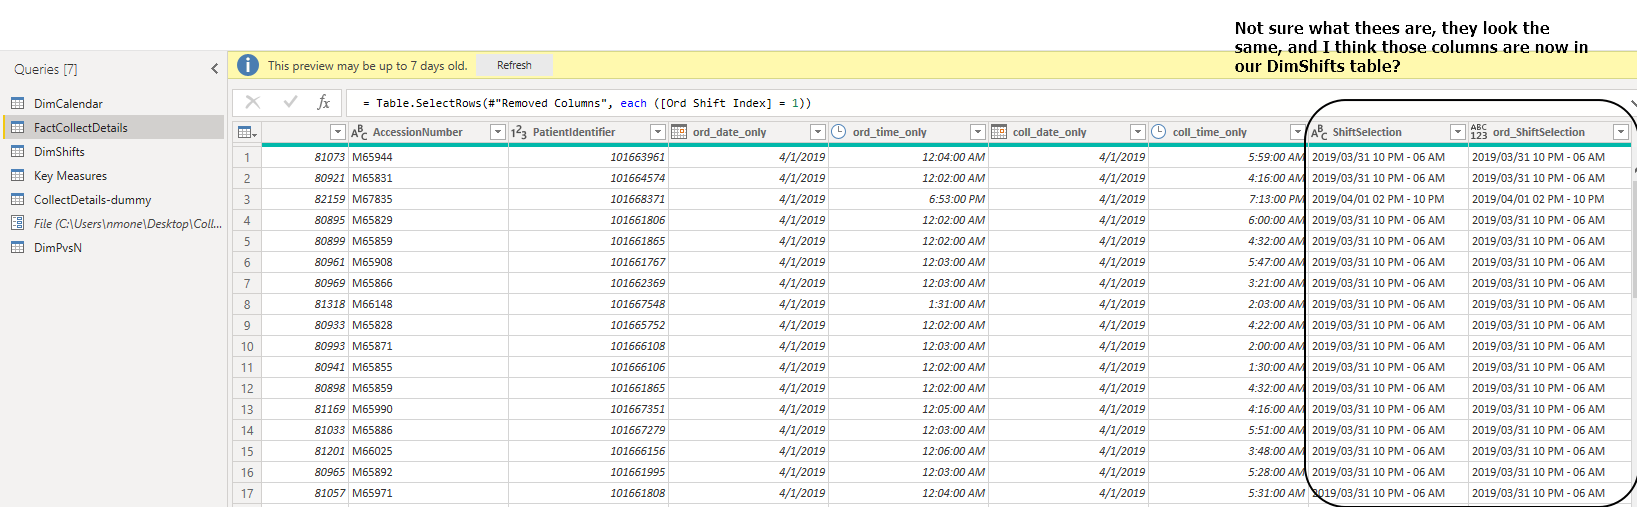
2- Add a new column CollectDetails[ord-shiftSelection] - where the shiftSelection data is generated from ord-date & time information.

Am I on the right track ?

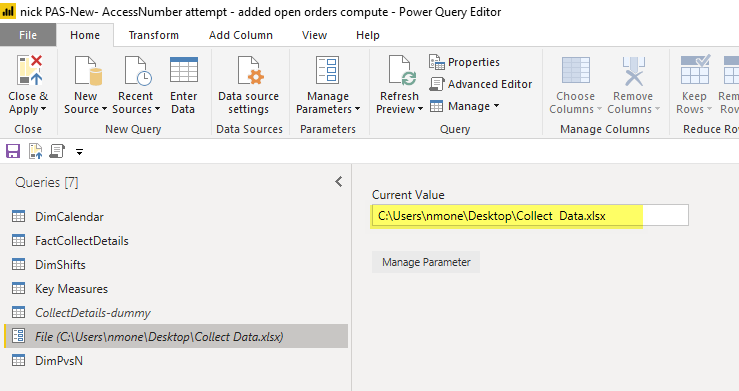
PBIX is here. PAS-New- AccessNumber attempt - added open orders compute.pbix (1.1 MB)

There’s a bit here.

The reality in my view is you just need to understand how the data model works and operates. It clear to me that you haven’t got a full handle on this yet.

For example, the measure you are using here.

This has all sorts of issues with it, and then you are placing a context here from the visual which comes from the fact table down here. The variables here are not working at all as you are expecting them to.

So this is never going to provide the filtering you require.

Always look to place you information into tables when trying to work out calculation errors.

image

You can see very quickly the filtering isn’t working, so that what you need to work out.

I recommend working through this course and in particular the model part of it, starting here…

Then work through the Mastering DAX course, and really look to understand ‘context’. This is so crucial here for you.

http://portal.enterprisedna.co/courses/108877/lectures/2000594

Honestly there is a lot of issues here with you problem, and I’m even a bit lost as to what you are trying to do with some of the things here.

Really try to simplify the problem you have down. Optimize it in the model and then your formulas should not be too complex.

Thanks
Sam

Thanks. will do.

Good evening, I went through above courses recommended and still not sure how to solve my problem. I feel ‘defeated’ :pensive:

I need to find out Remaining orders then further group by PatientID to get the distinct patients count for each shift selected.

The business logic to retrieve these remaining orders.

  1. look back 24 hours prior of selected begin shift date & time of the ordered placed - based on order date.
  2. Then check if the Coll_date & time is after the selected end shift date & time.

image
Eg : Selected shift = 2019-04-10 6:00 am - 02 pm

To grab all open remaining orders for the shift

  1. where Ord date & time between 2019-04-10 6:00 am - 02 pm & 2019-04-09 02 pm -10 pm (all open orders)
  2. and Coll date & time > 2019-04-10 2:00 pm (remaining)

Simple words, open orders = all orders placed 24 hours prior where are collected after the End shift date time.

Do you mind to guide me a little ?

BTW, I really like the training that I went through, actually it solved my other problem by leveraging 'Supporting Tables" technique! (Thank you! )

Please let me know if above business requirement needs further clarification.

It’s still not exactly clear here for me.

For example what context does this need to be visualized in?

If you need to look back a certain amount of time, then this particular text column isn’t really going to assist at all.

image

Somehow you need to create an hour column and then work back from there I would guess.

Now this will give you a number to evaluate time and 24 hours.

Past this, I’m a bit lost as don’t really know where to go next to assist. It’s still not exactly clear how this need to be represented or if you even have the data available to work this out. Currently I’m not seeing it.

This is what I currently have here

Thanks
Sam

Hi,

Sorry for my poor explanation. Let me try again.
This report has complex diff shifts data slicing data display requirements on the same page which really got me confused on data model setup.

On the same report, you have helped me with logic to show:-
1 - Current Shift details
2 - Previous shift details.
which is great.

Now I also want to display Remaining Patients.
In order to get the # of Remaining Patients - I need to grab all Remaining Orders 1st to do my computation. To make this simple, if I can grab all open orders details, then I can do the count on remaining patients myself.

So, the logic to grab open orders like so:

if I selected this shift : image

Then I want to grab all Open order details where orders placed 24 hours = past 4 shifts data based on Ord-Date. see below yellowed shifts are shifts that I want to select for my computation.

image

Just like in excel, these would be the 4 shifts details I want to select.
image

Then I would further check on the every rows in CollectDetails (with the above 4 selected shifts) where coll_date_only & coll_time_only > 2019-04-10 02:00:00 pm (which is the selected shift end date & time)

What I had done, I recomputed ShiftSelection based on ord-date and created an inactive relationship between Shifts[ShiftSelection] – > CollectDetails[ord_ShiftSelection] – see below:

I added 2 additional columns to table: CollectDetail for ease for my computation : ord_ShiftSelection & [Shift Index Ord Date].

I used it in my DAX to grab remaining patients like so:

Remaining Patients - Selected Shift = 
VAR EndShift =  SELECTEDVALUE( Shifts[Index], BLANK() )
VAR BeginShift = EndShift -3
VAR EndShiftDate = SELECTEDVALUE(Shifts[work_shift_end_date_only])
VAR EndShiftTime = SELECTEDVALUE(Shifts[work_shift_end_time_only])

VAR result =  COUNTROWS(GROUPBY(FILTER(all(CollectDetails), CollectDetails[Shift Index Ord Date] >= BeginShift && CollectDetails[Shift Index Ord Date] <= EndShift
           &&   CollectDetails[coll_date_only] > EndShiftDate 
           ||  (  CollectDetails[coll_date_only] = EndShiftDate
                    && MAX(CollectDetails[coll_time_only])  > EndShiftTime )

               ), CollectDetails[PatientIdentifier]))
return result

But this is still not right on below PvsN break down (see below). This also tells me that if I want to see all open orders details, I can’t do it at this point with the data model that I had set up.

Collect Data.xlsx (2.1 MB)
PAS-New- AccessNumber attempt - added open orders compute.pbix (973.7 KB)
image

Thanks again!

I played a bit more, and in this version, I am using ‘supporting table’ to solve this problem. Bad idea ?

I just make a copy of the CollectDetail table (without adding any relationships) then I continued to add a measure to see if a given row is considered as an open order ? Like So:-

IsOpenOrder Ind =

VAR shiftIndex = SELECTEDVALUE(Shifts[Shift Index])

RETURN IF ( MAX('CollectDetails-dummy'[Ord Shift Index]) >= shiftIndex - 3 && MAX('CollectDetails-dummy'[Ord Shift Index]) <= shiftIndex , 1, 0)

I am not convincing myself this is a good approach as I am duplicating data in this case.

Here is the updated pbix file:

PAS-New- AccessNumber attempt - added open orders compute.pbix (1015.4 KB)
Collect Data.xlsx (2.7 MB)

Good afternoon. Just curious if above implementation is a bad idea ?

@akiko_lim

This is not a great idea. Looks like the main problem here is that the current data model needs some work. There needs to be clear dimension(lookup) tables and clear fact tables. I assume your “CollectDetails” is your fact table here. But there a lot of columns that probably shouldnt be in this table and should be in their own table, like the Shift columns. Those should be a in Dimension table and then related to the fact table. Then when you use filters, those columns only should come from your dimension tables.

I’ll spend some time on this, but honestly, it needs some work. And I think that is why you are having a hard time writing these measures. The better the data model the easier the DAX.

Enterprise%20DNA%20Expert%20-%20Small

Thanks Nick. I agree. The data model does need some work to enable ‘data display’ capability ‘outside’ of the selected shift. This is where I got stuck. I have been watching training videos in enterprise DNA and hoping that I can find a video sample that will be closed to this data display requirement. Unfortunately has no success.

FYI: After a close examination on the previous shift data on Sam’s DAX formula. the data displayed is not correct. Where previous shift details data (other columns) displayed incorrectly.

I am going to keep playing with the data model as you had suggested to see if I could come up with a way to achieve this complex data display requirement.

Thanks again for ur reply.

I’ll put together something as well. I dont know this data as much as you do, so might not be 100%, but I think if we both work it the data model it will make the measures and the subsequent answers correct and much easier to author and trouble shoot

Enterprise%20DNA%20Expert%20-%20Small

Hi, I had been ‘sketching’ data model on papers for the past few days. Not able to come up with a good design to satisfy this requirement… :sweat:

@akiko_lim
Please take a look at the attached and see if this is making sense. I had to make some guesses about your data, but nothing that cannot be undone. Here’s what I did so far

  1. Created a “DimShifts” table from your main table (which is now called “FactCollectDetails”
  2. Created a “DimPvsN” table as well.

Related those two tables (along with your calendar table) to the main table. You can step through the applied steps to see how exactly I did this. There is a parameter in Power Query which you can change enter in the location of the data file, otherwise it will say cannot find data.

We want to use our smaller lookup tables (or Dimension) tables to filter the bigger fact tables. Things can become much easier once the data model is setup in a way which works with DAX and not trying to fight against it.

Another thing I made sure to do was set the data types before loading the data into PBI. Always good practice to do that.

So here’s our new data model:

One thing I wasnt 100% sure on was:

I think this makes sense, but could you take a look and let me know your thoughts?

File:
nick PAS-New- AccessNumber attempt - added open orders compute.pbix (222.7 KB)

Enterprise%20DNA%20Expert%20-%20Small

Thanks Nick for your effort. Sorry for my late reply. Have been @ client’s side.
PvsN normalization makes perfect sense. thanks!

You are correct, ShiftSelection & Ord_ShiftSelection in detail table can go since I refer back to the Shift Index column in this case.

With my quick glance today, the problem remains where I don’t know how to display my open order details based on selected shift. I am going to play a little bit more … appreciate your kindness to try & share.

@akiko_lim
Thanks for getting back to me on this. I think the data model is getting there. I’m going to work on this and see what I can come up with.

Enterprise%20DNA%20Expert%20-%20Small

@akiko_lim,

Does the following look correct in regards to the business logic.

Enterprise%20DNA%20Expert%20-%20Small

Hi Nick, thanks for the reply.
Yes, Your logic is correct to grab the # of shifts for (1) displayed above.
Yes, the logic to get the Total remaining open orders also correct as you had explained.

Getting the single #, no issue. The part that I stumble on is to display the data in details with visuals.

@akiko_lim

It’s all part of the process. Need to have the data model and business logic down before trying to write some DAX.

Enterprise%20DNA%20Expert%20-%20Small

Hi Nick, I tried another approach by completely removed all relationships on ‘Shift’ table.

Then added 3 new measures to my CollectDetails table to have 1 or 0 as an indicator on if I need to show the details data at all. (please note, these measures can be moved to Key Measures table)

With this ‘no relationship’ approach, I can display data in my detail table anyway I want.

Here is the updated pbix file. Feel free to comment.
This idea was triggered by this training video.

( Multi Threaded Dynamic Visuals in Power BI - Advanced Power BI and DAX Techniques)

PAS-New- AccessNumber attempt - added open orders compute.pbix (922.9 KB)

Thanks again for your kind support. You are wonderful! :+1:

@akiko_lim-
Awesome job! And this was all your doing so congrats to you!

Enterprise%20DNA%20Expert%20-%20Small