Thanks for the quick reply Brian, I really appreciate it.
I think there might be a Python solution using plotly as outlined here:
Something that was pretty close to what I needed was the Impact Bubble Chart
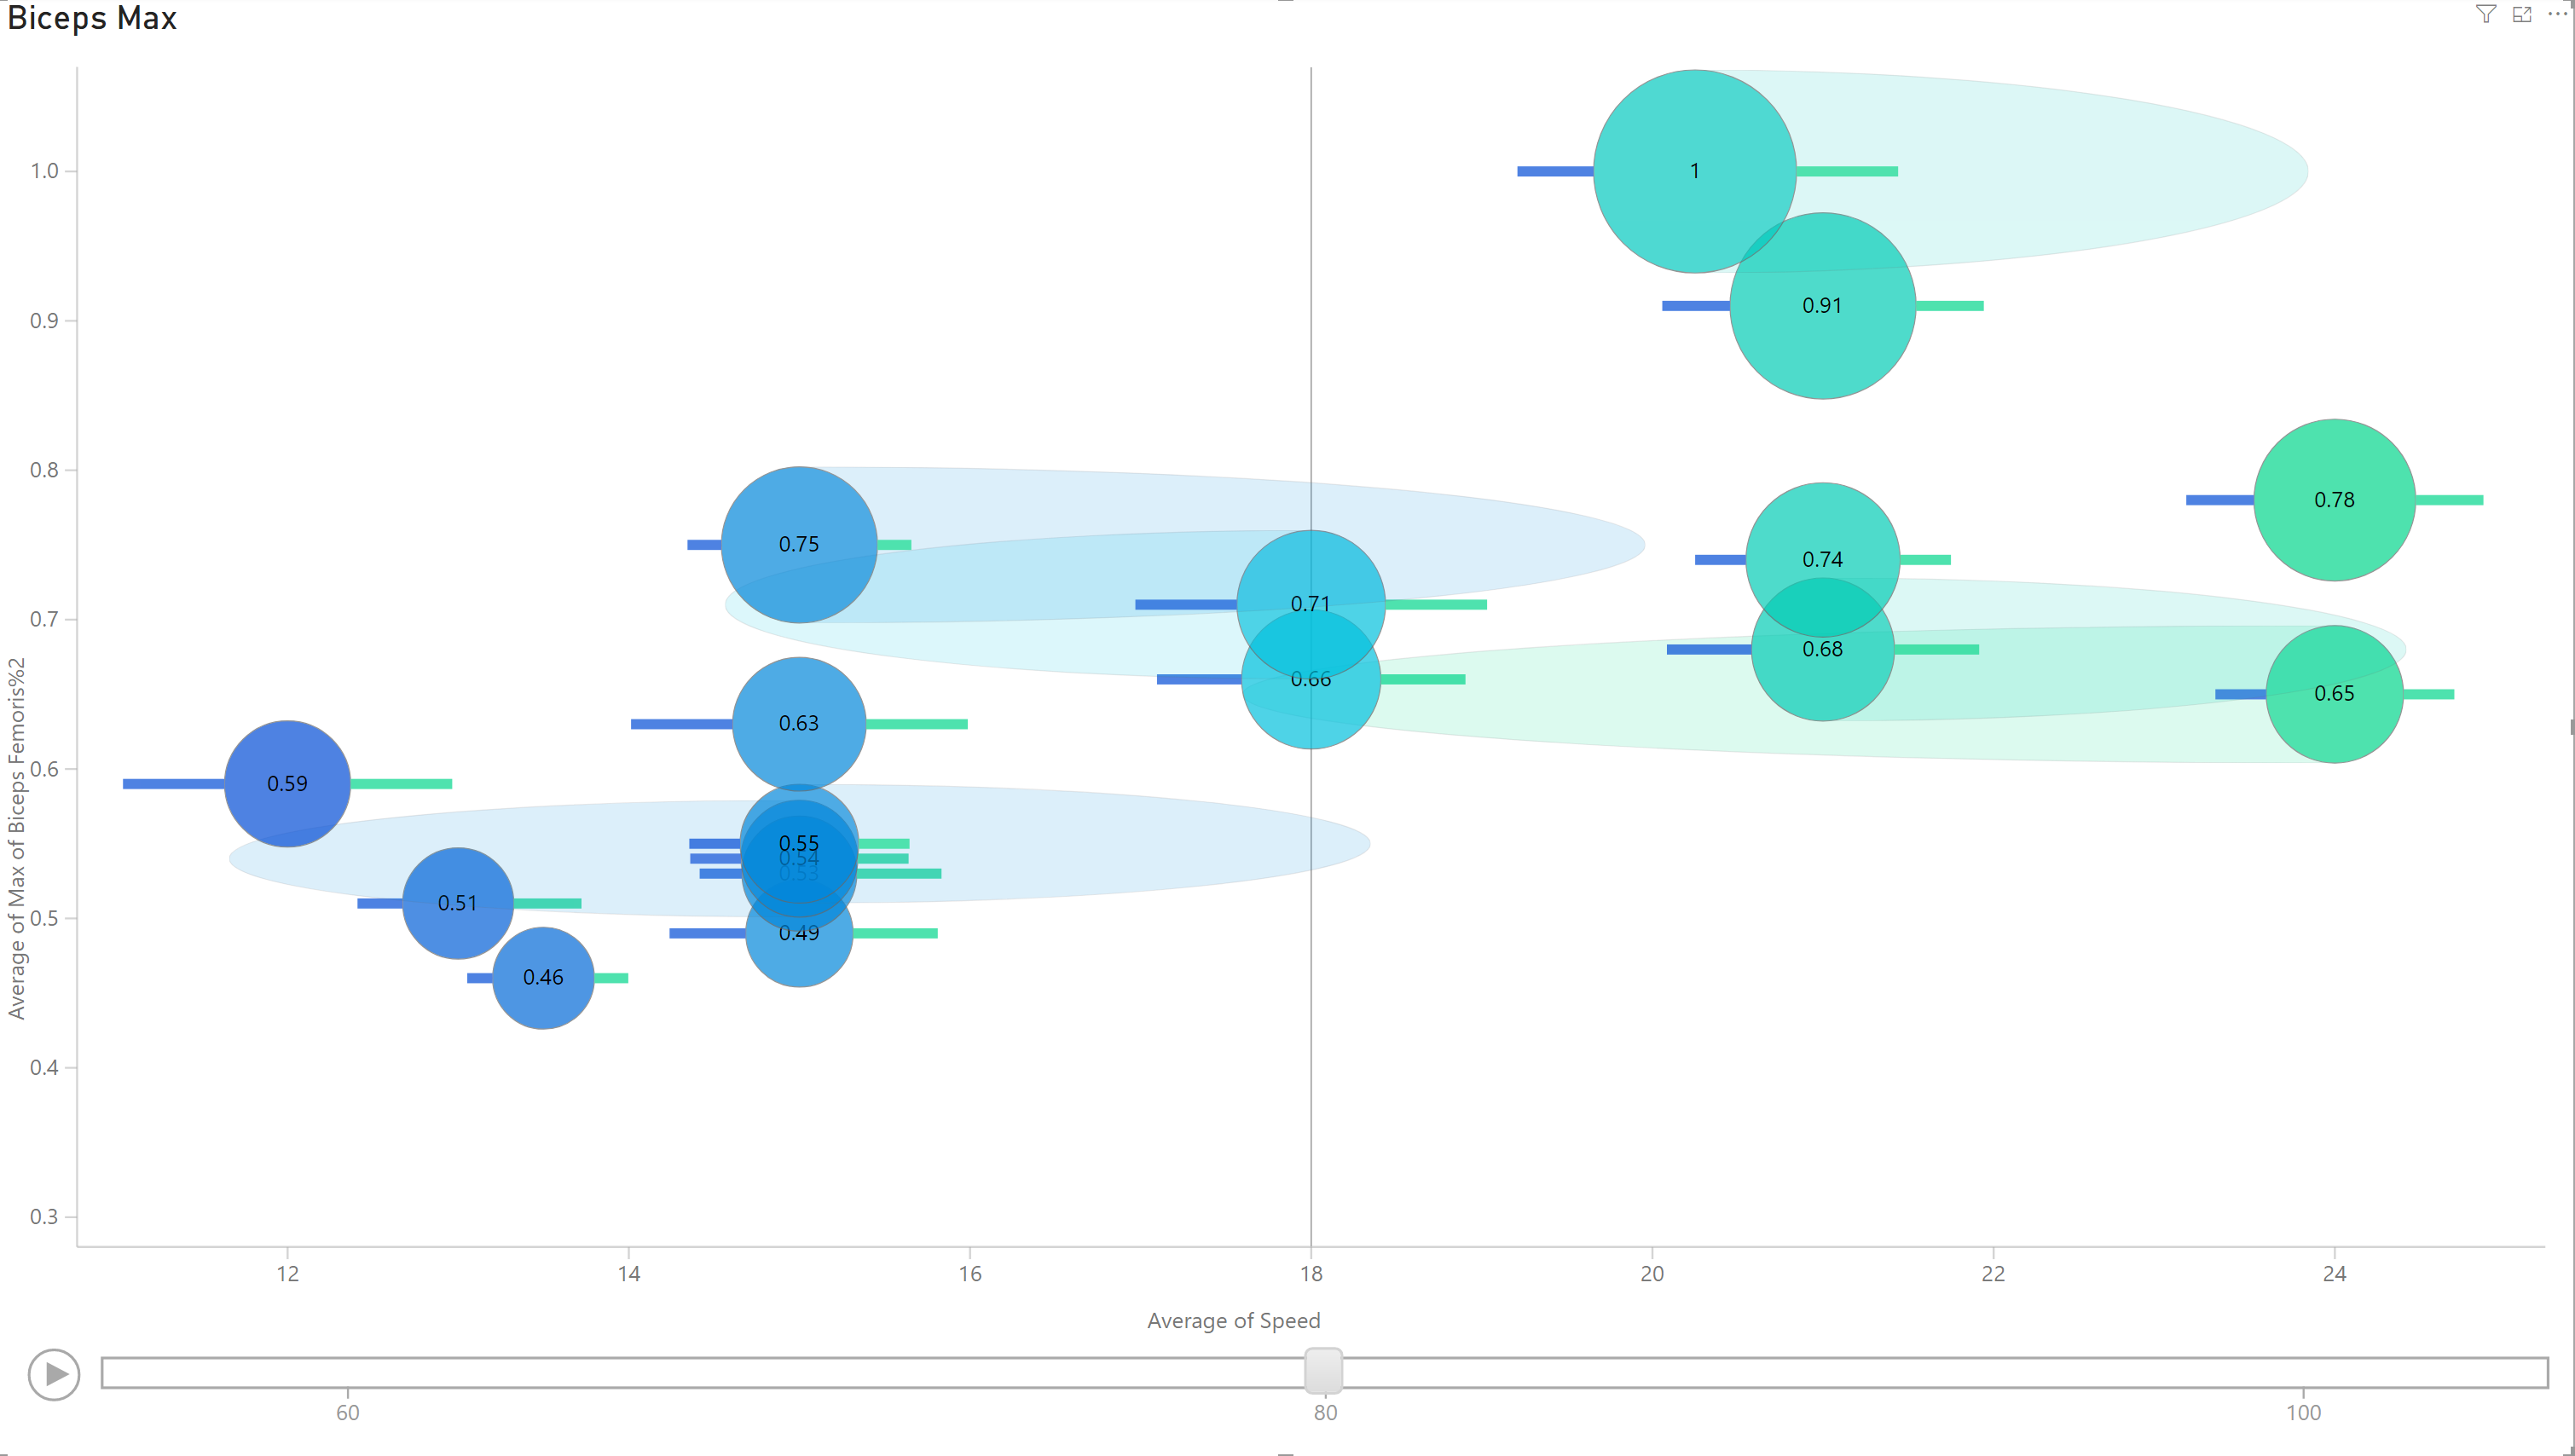
This may actually do the trick, but I need to dig deeper into the specifications and field wells as it’s not appearing entirely intuitively, nor does it seem to match up with the data.
Thanks again,
Rod