2 measures in a donut chart

I have to create a donut chart with two categories “sold” and “unsold”, both are measures.
Is there any way to put two measures in a donut chart

Hi @Anu,

You can only place measures in the Values section of a Pie or Donut chart.
I hope this is helpful.

You could try the Sunburst custom visual; see if that is something like you want …

image i want something like this, here Sold and Unsold are both measures

@Walter did some very cool customization of the standard donut chart in Challenge #2 that you may want to take a look at:

Power BI Challenge 2 - Customer Insight - #46 by BrianJ

  • Brian

Hi @Anu. One possibility is to create a “placeholder” supporting table to hold your measures, then plot that. You can overlay a card to get the total in the centre as per your sketch. Hope this helps. Greg
eDNA Forum - 2 Measures in a Donut Chart-1


eDNA Forum - 2 Measures in a Donut Chart.pbix (19.2 KB)

2 Likes

What if I want to filter it by say, different projects?

Hi @Anu. I’d imagine that if your measures are appropriately calculated by your slicer selections, then all should work easily. If not, please post a sample PBIX with your work-in-progress and a mock-up of your desired outcome to help us pursue further. Thanks, Greg

Measures in a Donut Chart.pbix (19.2 KB)
It was simple as that.

Hello @Anu,

Thank You for posting your query onto the Forum.

As @Greg had mentioned earlier, measures will work appropriately and you shall be able to filter it if they’re written and calculated as per the slicer selections required.

The reason why it didn’t work in your case was because you had hard coded the numbers in your Sold and Unsold measures. Below are the formulas provided for the reference -

Sold Measure = 1650000000

And

Unsold Measure = 500000000

Therefore, it was not able to slice and dice as per the filters selection.

Below are the revised measures provided for the reference that I’ve written in your file -

Sold Measure - Harsh = 
CALCULATE( [Total Measure] , 
    FILTER( Donut , 
        Donut[Type] = "Sold" ) )

And

Unsold Measure - Harsh = 
CALCULATE( [Total Measure] , 
    FILTER( Donut , 
        Donut[Type] = "Unsold" ) )

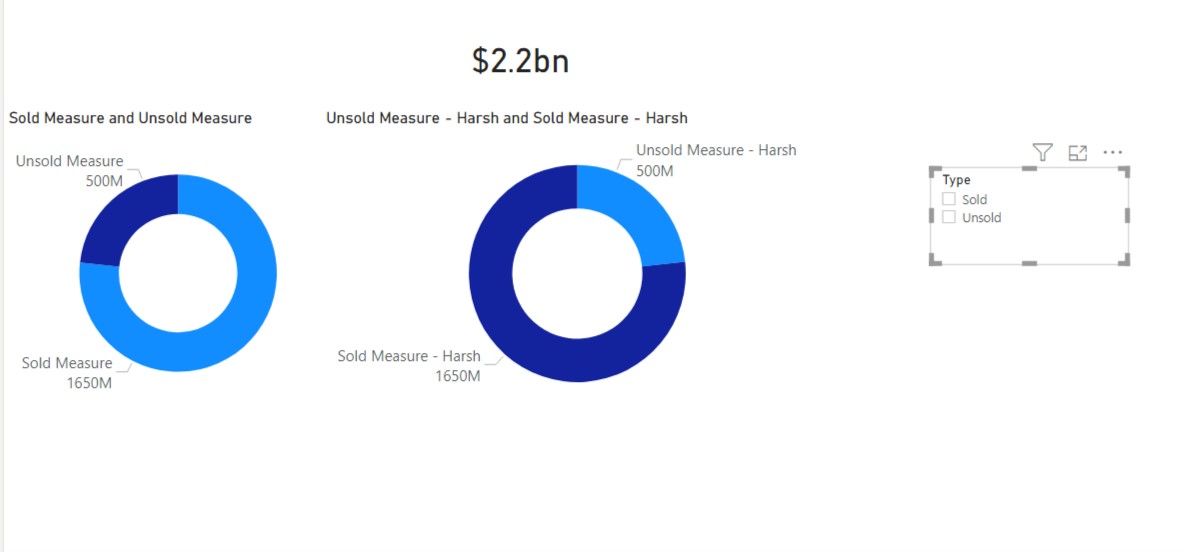
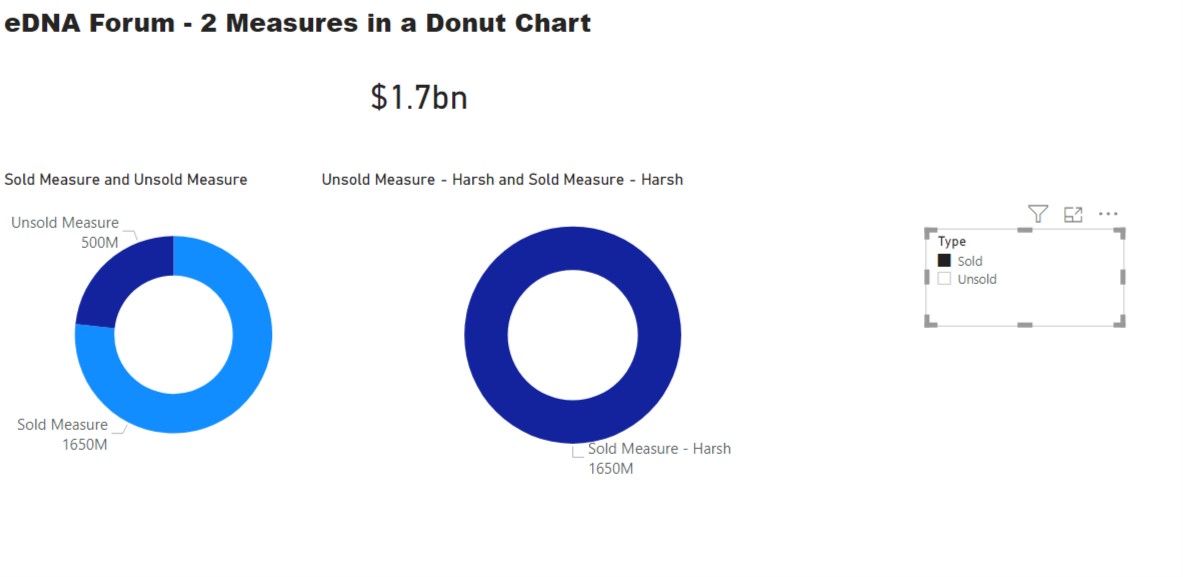
Now, if you observe after writing both of these measures it will be able to slice and dice as per the selection made into the slicer. Below are the screenshots of the results provided for the reference -

I’m also attaching the PBIX file of the working for the reference.

Hoping you find this useful and meets your requirements. :slightly_smiling_face:

Thanks and Warm Regards,
Harsh

Measures in a Donut Chart.pbix (19.9 KB)

If resolved, can you please mark the thread as solved? Thanks, Greg