Hello Forum
I’m new to Power Bi and Dax and I’m trying to achive a 12 week moving average.
Issues - My table has no values each row is a transaction in the main table.
I want to ignore weeks where there are no transactions for a paticular store.
I need to analyse by store on one visual so i can compare the average of each store over time and check variances.
I’m a bit lost with the logic and most examples I have preactice all have sales totals and my data is based on row counts.
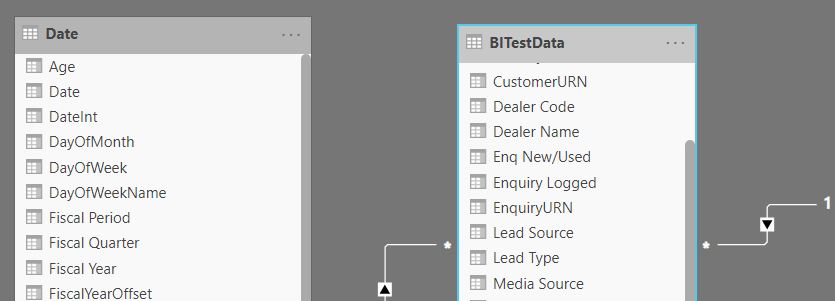
I have three tables: 1. date 2. Transactions multiples dates , multiple stores, multiple customers, multiple sales persons. 3. Store table list of all the stores what sales area they belong to and who is responsible.
I will create a 4th table an aggregate of the transaction - total count for each store as a table.
Can any one help, I’m getting myself mixed up.
Thank you
Hi @Jessica
Welcome to the forum. It is advisable if you can share your pbix so we can look at it.
It is very difficult to understand the model this way and to suggest any solution.
What I could understand that you are facing problem in achieving 12 weeks moving avg, that’s possible
No matter how your data is, we can achieve every solution if you have all the necessary information for calculating those in your data.
It looks interesting I would love to spend time on it as the weekend is also approaching, so would love to give it a try. Please share as much information possible and your pbix file for raw data through excel.
Thanks,
Ankit Kukreja
www.linkedin.com/in/ankit-kukreja1904
Thanks for posting your question @Jessica. To receive a resolution in a timely manner please make sure that you provide all the necessary details on this thread.
Here is a potential list of additional information to include in this thread; demo pbix file, images of the entire scenario you are dealing with, screenshot of the data model, details of how you want to visualize a result, and any other supporting links and details.
Including all of the above will likely enable a quick solution to your question.
@kkrj.ankit
PowerBIStoresTEST2020.pbix uploaded.
PowerBIStoresTEST2020.pbix (387.4 KB)
Hi I have added the PowerBIStoresTEST2020.pbix, if that helps.
Hi @Jessica
Thanks for the file. It would be great if you can explain your requirement, what do you want to achieve exactly and as I can see you’re model 1 to many relationships and that is the best thing to have.
I cannot understand the problem here as the data you’ve shared is not complete and store code and store no doesn’t have any common data in this sample. So, it would be really difficult for me to advise anything for you in that case.
Requesting you to share all the data except the PII (like phone no, address, email , etc) and please specify what do you want to achieve.
Thanks,
Ankit Kukreja
www.linkedin.com/in/ankit-kukreja1904
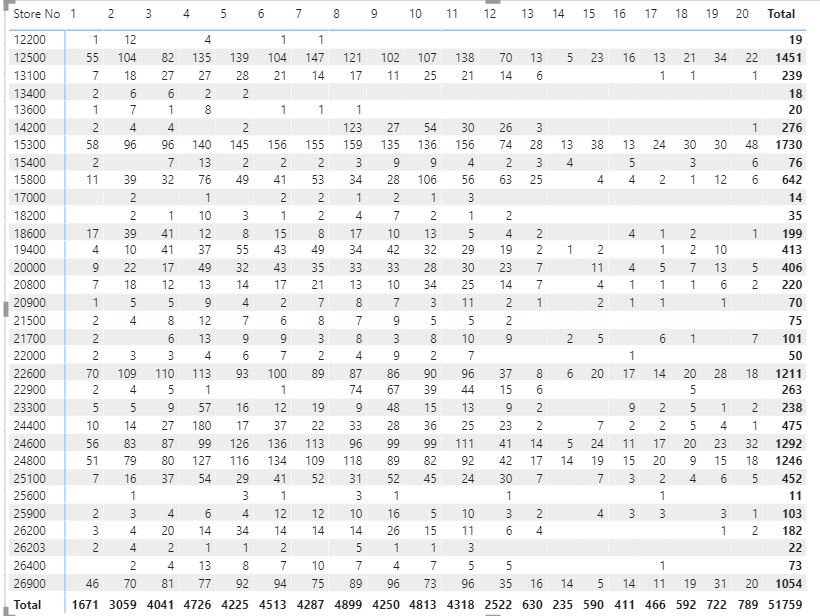
Aaah sorted now , have uploaded version 2 with the corrrect store codes… so I will have some sort of visual which will have the store codes and then the number of enquries for each store by week number ( this is achieved by counting the enqury date rows for each store).
What I want is for each store to have a moving 12 week average which ignores weeks with no data. Then I would plot in a bar chart the the 12 week averge for each dealer to see the variance.
Do I need an aggregate table as i’m relying on the count of rows to perform the calculations or can this be achived without?
I’m not sure where to start
It can be achieved through dax. Go through the below videos it will help you a lot.
Hi @Jessica, a response on this post has been tagged as “Solution”. If you have a follow question or concern related to this topic, please remove the Solution tag first by clicking the three dots beside Reply and then untick the check box. Thanks!